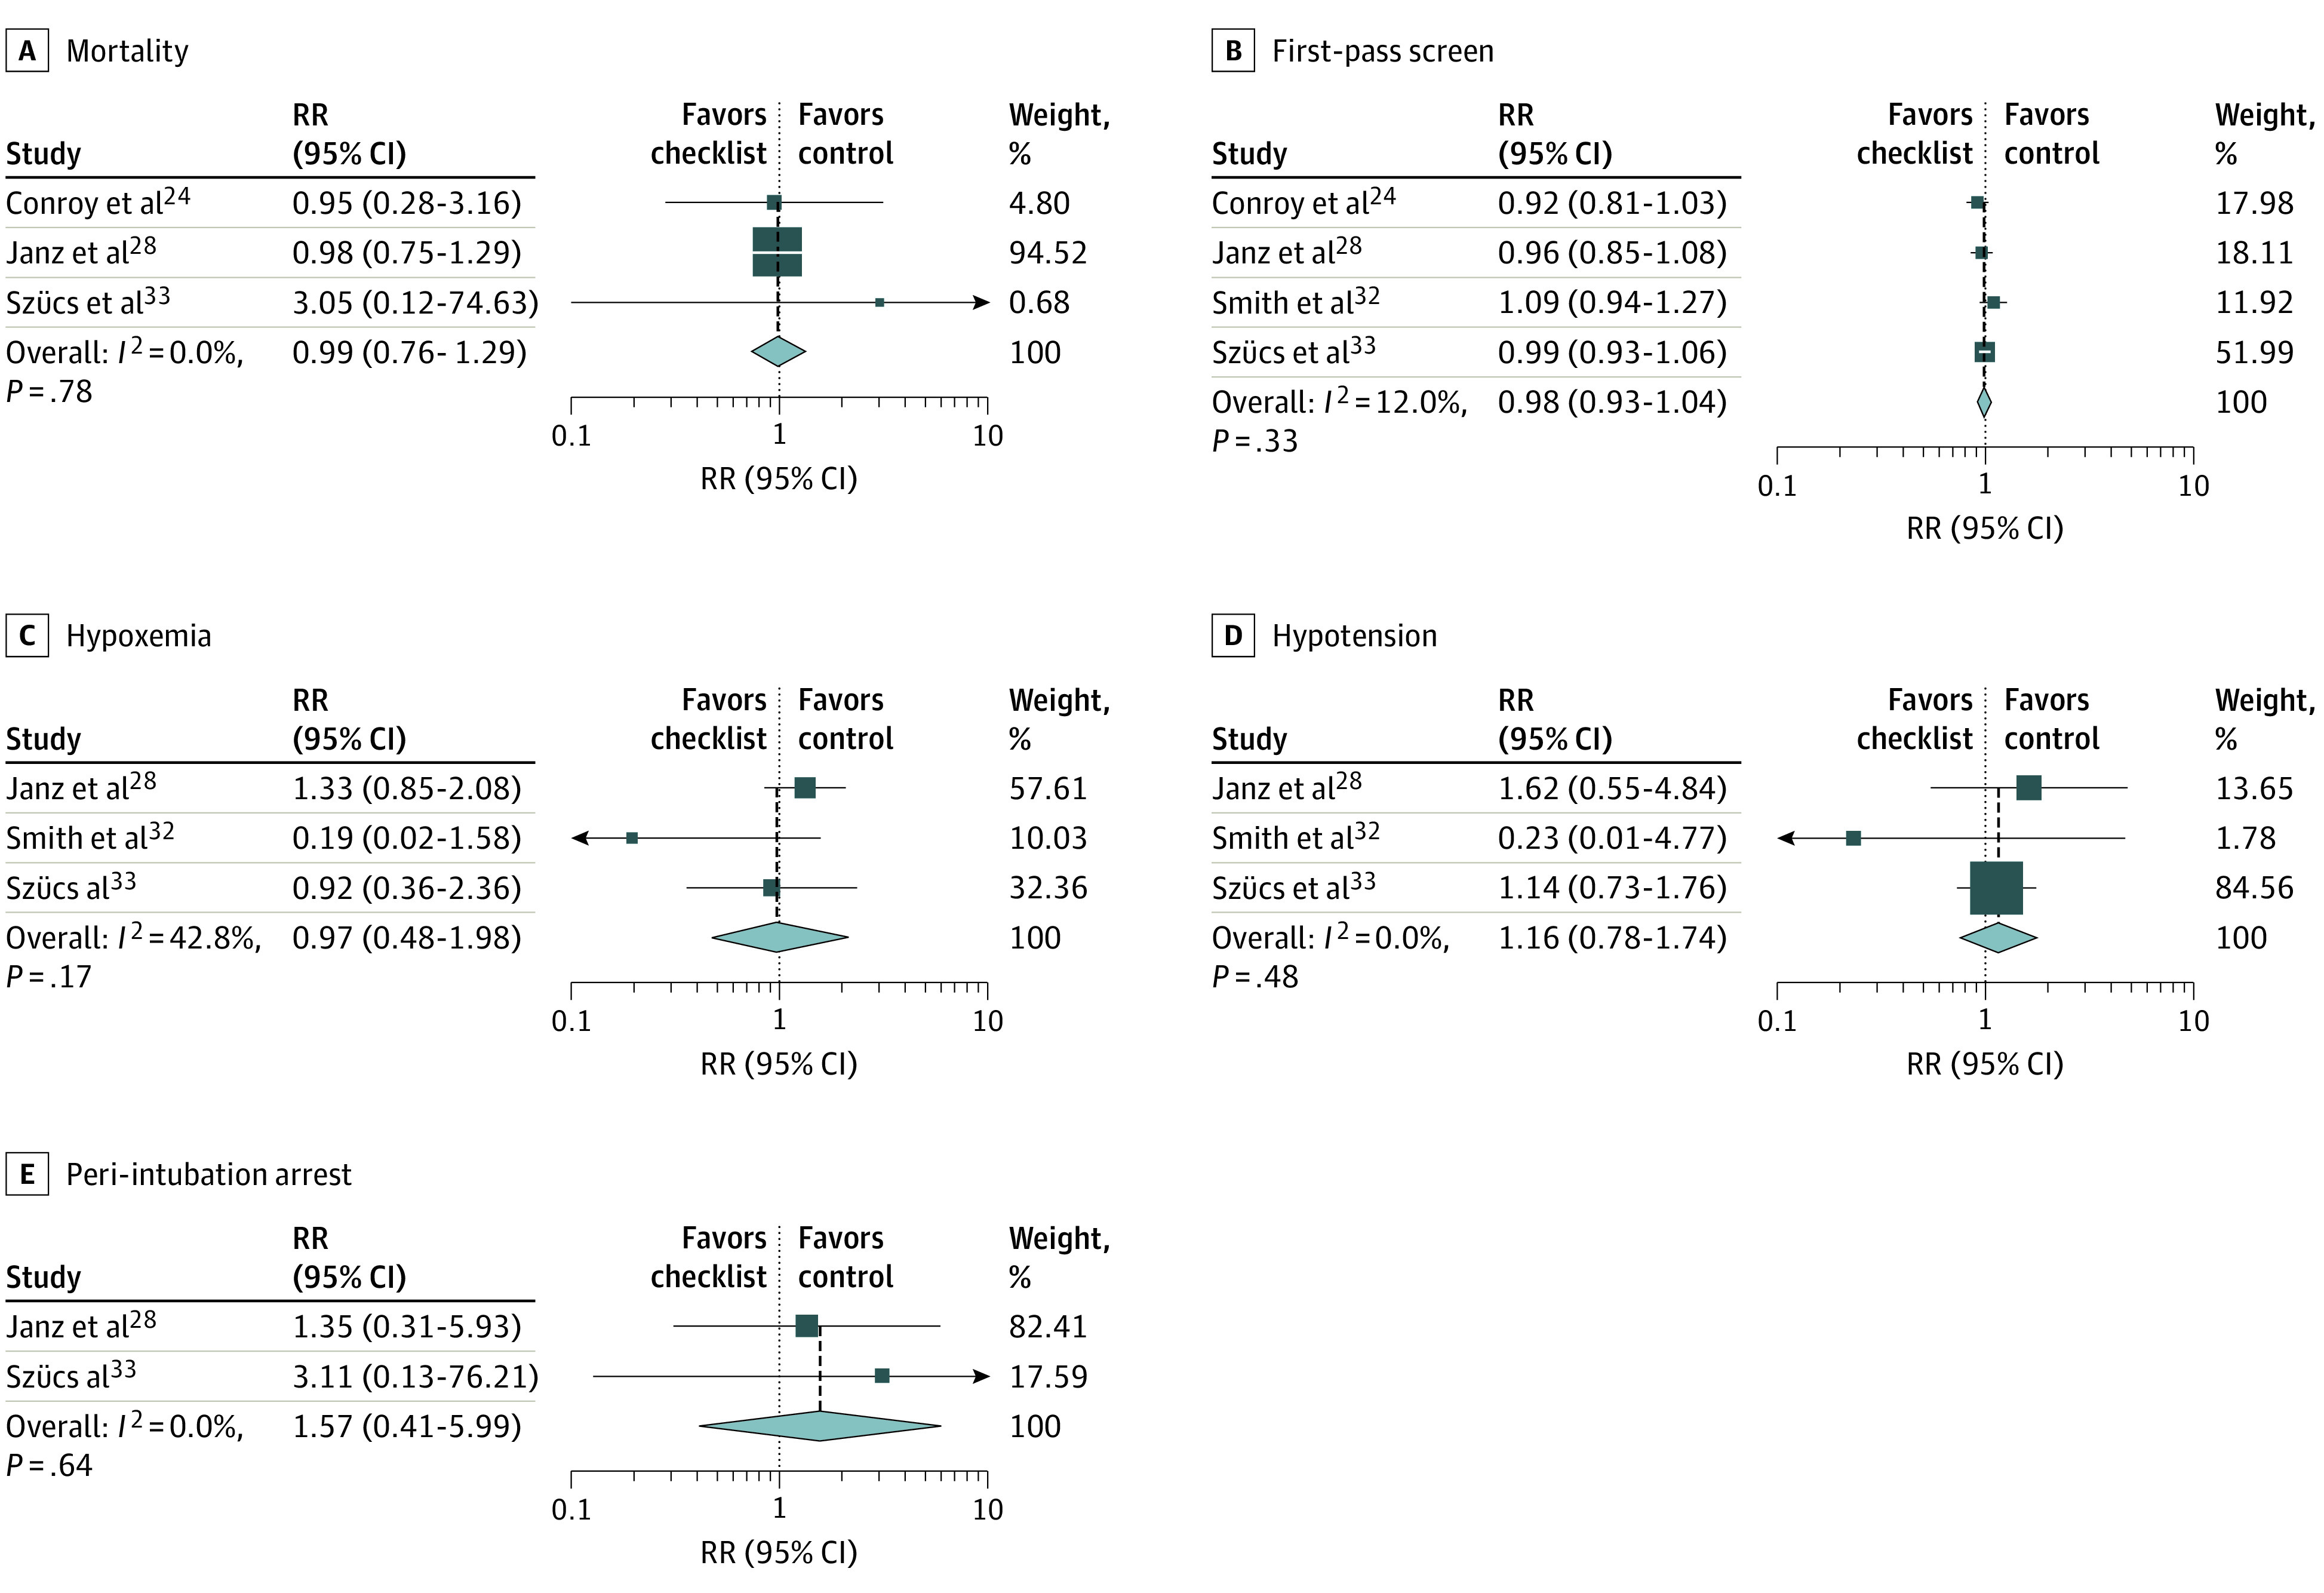
Figure 3. Low Risk of Bias Sensitivity Analysis.

Squares indicate relative risk (RR) estimates, with horizonal lines representing 95% CIs. Diamonds represent pooled estimates, with points indicating 95% CIs. Vertical dashed lines represent the relationship of the 95% CIs around each individual study result with the pooled mean. Weights are from random-effects analysis. A, E, and F, The study by Smith et al32 was not included in the analysis.
