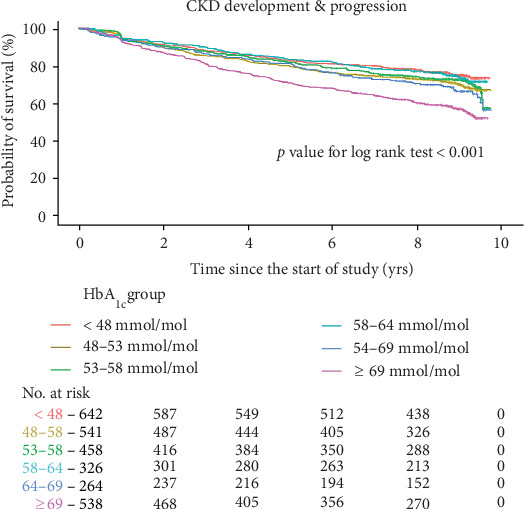
Figure 2.

Kaplan-Meier curves for the development or progression of chronic kidney disease according to baseline glycated hemoglobin. Abbreviations: HbA1c: glycated hemoglobin; CKD: chronic kidney disease; No.: number. Kaplan-Meier curves stratified by baseline HbA1c into six groups. Renal outcome was defined as a composite event of the first CKD development in the CKD-naïve group (n = 2357) and CKD progression in the preexisting CKD group (n = 412).
