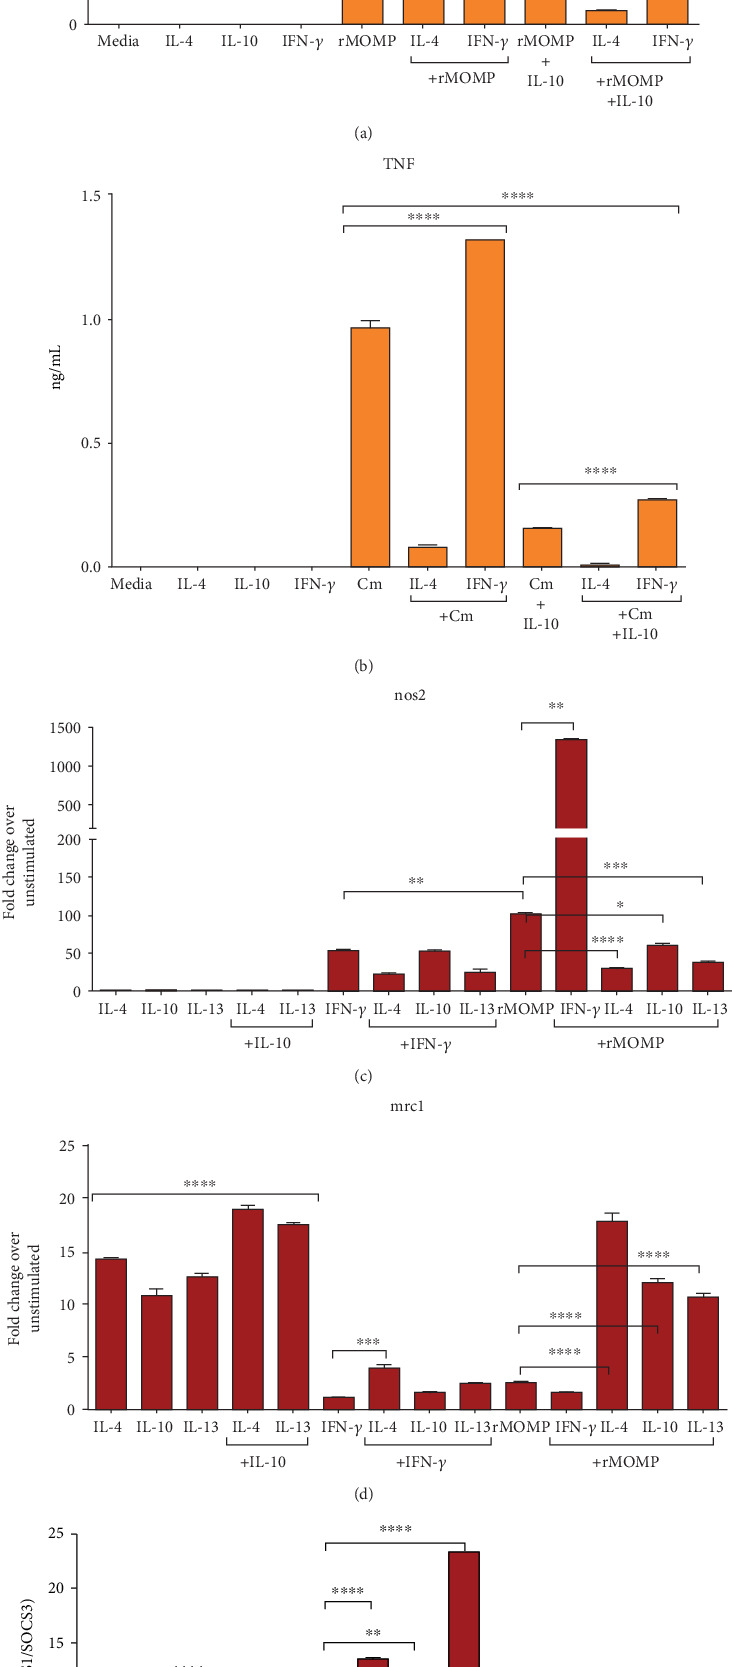
Figure 7.

Impact of macrophage polarization on TNF expression, macrophage phenotypes as well as SOCS ratios in rMOMP cultures. Macrophages (106/mL) were pre-incubated with IL-4 or IFN-γ (each at 10 ng/mL) for 1 h followed by stimulation with either Cm or its rMOMP in the presence and absence of IL-10 for an additional 24 h. Cell-free culture supernatants were collected to quantify TNF by ELISA (A-B). Macrophages were pre-incubated with IL-4, IL-10, IL-13, or IFN-γ for 1 h followed by stimulation with rMOMP for an additional 24 h. The mRNA gene transcripts for nos2, mrc1, socs1 and socs3 (C-E) were quantified via TaqMan qRT-PCR. An asterisk indicates significant differences (P <0.05), and P values were calculated as described in Figure 1 legend. Each bar represents the mean ± SD of samples run in triplicates, and each experiment was repeated at least 3 to 4 times with a representative experiment shown.
