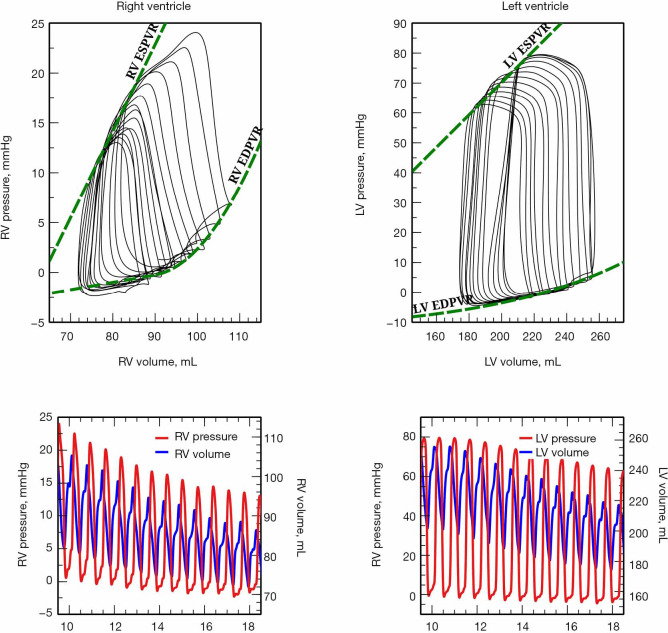
Figure 2.
Simultaneous right and left ventricular pressure-volume (PV) loops during an inferior vena cava occlusion. Simultaneous recording of right and left ventricular volumes (blue line) and pressures (red line), from which pressure-volume loops were constructed (top, black lines). The dashed green lines represent the end-systolic and end-diastolic pressure-volume relationships (ESPVR and EDPVR), respectively.

