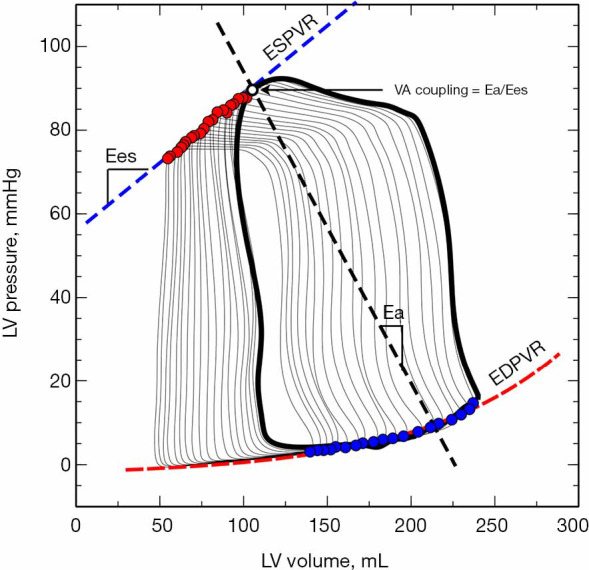
Figure 3.

Example of the left ventricular pressure-volume loops during and inferior vena cava occlusion. Left ventricular PV loops during a transient inferior vena cava occlusion (IVC). Red points represent the maximal elastance for each cardiac cycle and the straight line connecting them the end-systolic pressure-volume relationship (ESPVR, blue dashed line). The slope of ESPVR defines the LV end-systolic elastance (Ees), a marker of LV contractility. The exponential curve represented by a dashed red line depicts the end-diastolic pressure-volume relationship (EDVPR), which characterizes the diastolic properties of the ventricle. The dashed black line connecting the end-systolic pressure with the stroke volume (defined by the width of the PV loop: end-diastolic volume minus end-systolic volume) represents the effective arterial elastance (Ea), a net measure of arterial load. The crossing point where the slope of ESPVR (Ees) intersects with the Ea defines the ventriculo-arterial (VA) coupling.
