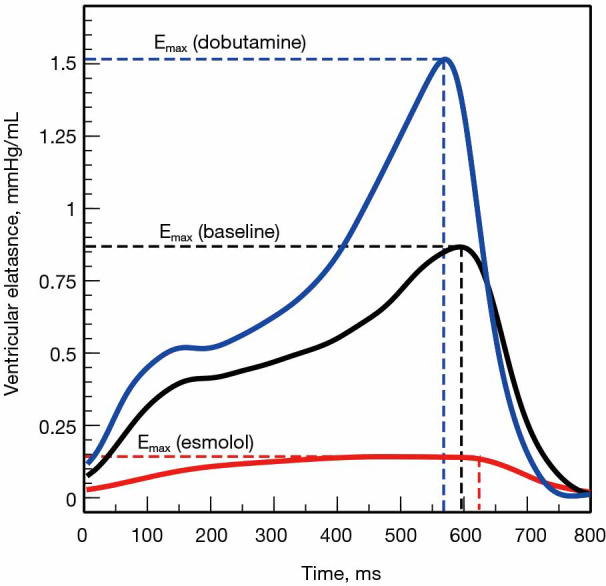
Figure 5.

Time-varying elastance model. Time-varying elastance or E(t) curves obtained from the simultaneous measurements of left ventricular pressure and volume in an experimental animal submitted to changes in contractility with dobutamine (blue curve) and esmolol (red curve). Elastance increases during systole until reaching a maximal value (Emax) at the end of the systole. Changes in contractility affect not only the amplitude but also the time to reach Emax: the better the contractility, the higher the magnitude and the sooner the Emax.
