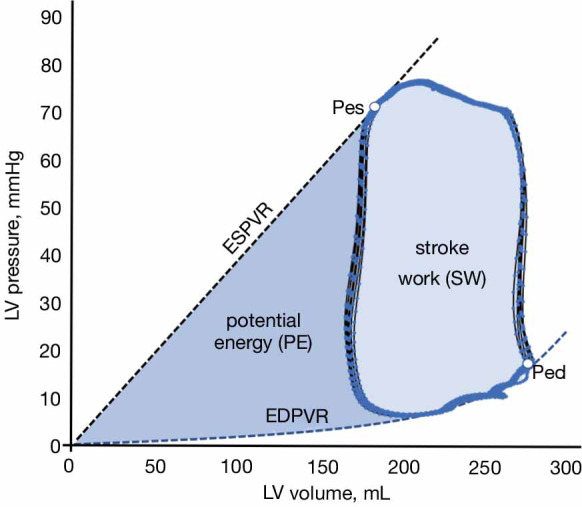
Figure 6.

Cardiac energetics analysis from the pressure-volume analysis. The external or stroke work performed by the ventricle is represented by the area within the PV loop (light blue area). The potential energy (PE) represents the elastic energy stored in the ventricle at the end of the systole (dark blue area). The total pressure-volume area (PVA) is defined as the sum of SW and PE. ESPVR and EDPVR indicate the end-systolic and end-diastolic pressure-volume relationships, respectively. Pes and Ped are the end-systolic and end-diastolic pressures.
