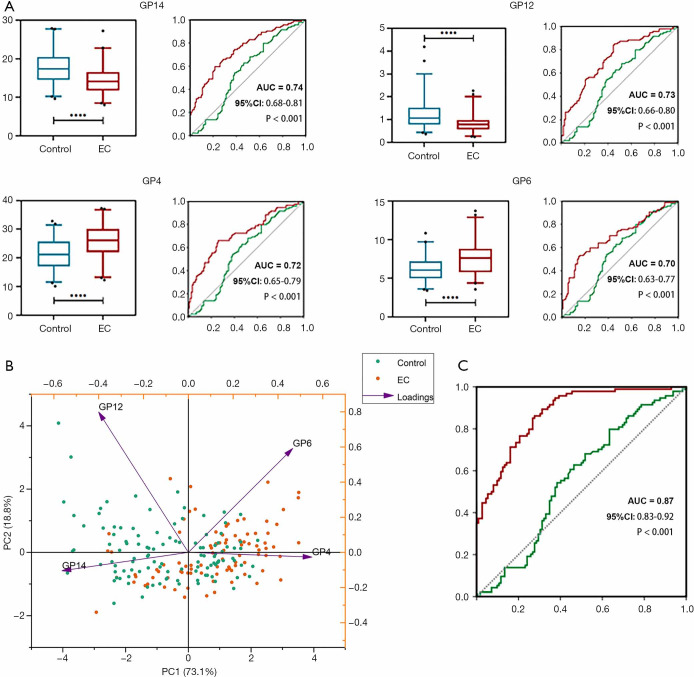
Figure 2.
Classification of endometrial cancer patients using IgG glycans. (A) ROC curve illustrating the performance of individual glycans (GP4, GP6, GP12, and GP14) for discriminating between the EC cohort and the control cohort. From the ROC results, age and BMI alone could not differentiate EC patients from healthy individuals (green line), and the addition of glycan traits increased discriminative power (red line). (B) Principal components analysis (PCA) score plot showing differences in GP4, GP6, GP12, and GP14 glycans between the EC and control cohorts. (C) ROC curve illustrating the combined performance of glycans in distinguishing EC samples from control samples. A green line represents the ROC curve for age and BMI only, while a red line represents the ROC curve for age and BMI with the addition of glycan traits. AUC, area under the curve; PC, principal component (see Figure 1 for other definitions).

