Table 2. Differences of directly measured glycans in the EC and control cohorts.
| Glycan peak | Description of glycan structures | Median (IQR) | P | ||
|---|---|---|---|---|---|
| Control (n=112) | EC (n=94) | ||||
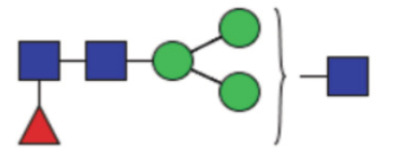
| GP1a | Percentage of FA1 glycan in total IgG glycans |
|
0.12 (0.086–0.16) | 0.11 (0.079–0.14) | 0.52 |
| GP2 | Percentage of A2 glycan in total IgG glycans |

|
0.53 (0.38–0.71) | 0.60 (0.38–0.84) | 0.045* |
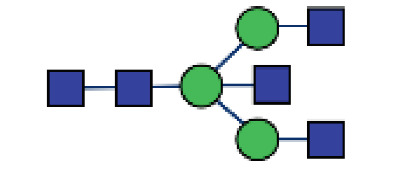
| GP3 | Percentage of A2B glycan in total IgG glycans |
|
0.074 (0.061–0.11) | 0.069 (0.046–0.94) | 0.027* |
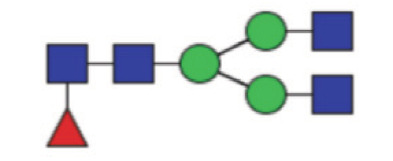
| GP4 | Percentage of FA2 glycan in total IgG glycans |
|
21.14 (17.02–25.68) | 26.10 (21.95–30.06) | <0.0001* |
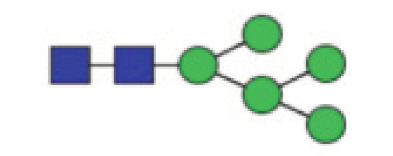
| GP5 | Percentage of M5 glycan in total IgG glycans |
|
0.11 (0.082–0.31) | 0.081 (0.066–0.11) | <0.0001* |
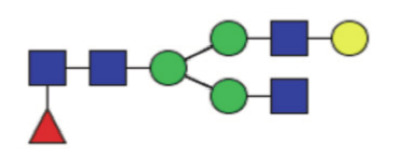
| GP6 | Percentage of FA2B glycan in total IgG glycans |
|
6.06 (5.00–7.20) | 7.60 (5.78–8.80) | <0.0001* |
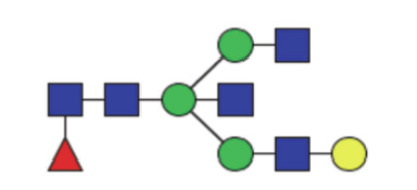
| GP7 | Percentage of A2G1 glycan in total IgG glycans |
|
0.32 (0.25–0.42) | 0.30 (0.21–0.38) | 0.16 |
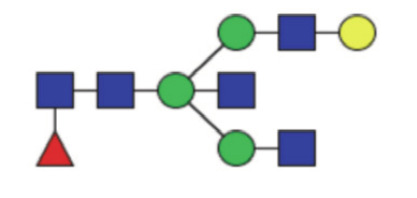
| GP8a | Percentage of A2BG1 glycan in total IgG glycans |
|
0.13 (0.052–0.23) | 0.15 (0.10–0.27) | 0.51 |
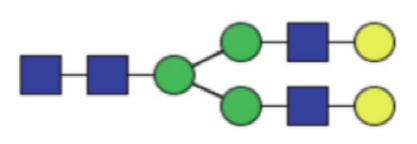
| GP8b | Percentage of FA2[6]G1 glycan in total IgG glycans |
|
21.39 (19.81–22.80) | 21.14 (19.47–22.62) | 0.43 |
| GP9 | Percentage of FA2[3]G1 glycan in total IgG glycans |
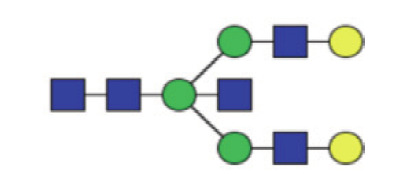
|
9.71 (8.30–11.09) | 9.47 (8.258–10.60) | 0.49 |
| GP10 | Percentage of FA2[6]BG1 glycan in total IgG glycans |
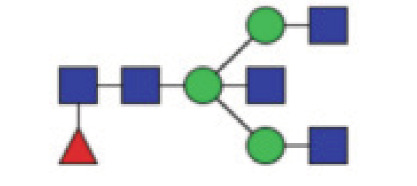
|
6.26 (5.47–7.02) | 6.73 (5.86–7.83) | 0.004* |
| GP11 | Percentage of FA2[3]BG1 glycan in total IgG glycans |

|
0.65 (0.54–0.92) | 0.70 (0.61–0.82) | 0.67 |
| GP12 | Percentage of A2G2 glycan in total IgG glycans |
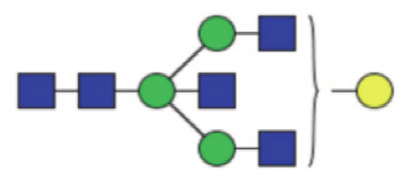
|
1.06 (0.78–1.53) | 0.79 (0.57–0.98) | <0.0001* |
| GP13 | Percentage of A2BG2 glycan in total IgG glycans |
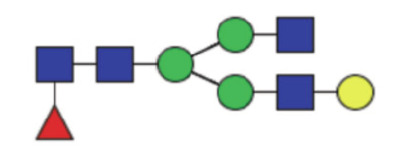
|
0.18 (0.14–25) | 0.17 (0.15–0.22) | 0.62 |
| GP14 | Percentage of FA2G2 glycan in total IgG glycans |
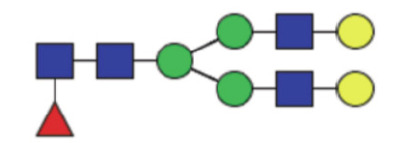
|
17.35 (14.53–20.49) | 14.14 (11.79–16.55) | <0.0001* |
| GP15 | Percentage of FA2BG2 glycan in total IgG glycans |
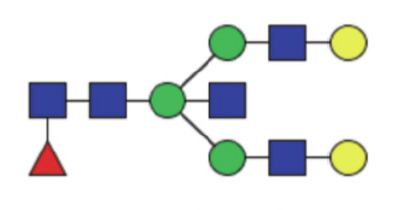
|
1.90 (1.58–2.39) | 1.71 (1.33–2.13) | 0.010* |
| GP16a | Percentage of FA2G1[6]S1 glycan in total IgG glycans |
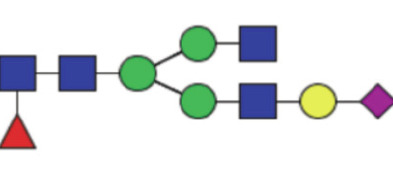
|
0.16 (0.13–0.21) | 0.15 (0.12–0.19) | 0.11 |
| GP16b | Percentage of FA2G1[3]S1 glycan in total IgG glycans |
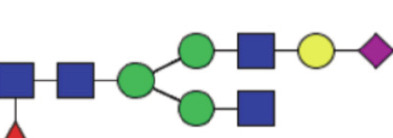
|
1.49 (1.22–1.85) | 1.59 (1.21–1.84) | 0.60 |
| GP17 | Percentage of A2G2S1 glycan in total IgG glycans |

|
0.84 (0.66–1.12) | 0.54 (0.41–0.67) | 0.001* |
| GP18a | Percentage of A2BG2S1 glycan in total IgG glycans |
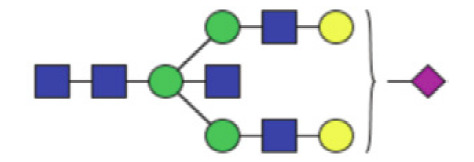
|
0.029 (0.019–0.060) | 0.037 (0.025–0.051) | 0.17 |
| GP18b | Percentage of FA2G2S1 glycan in total IgG glycans |
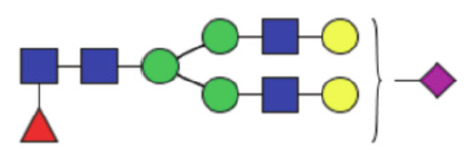
|
6.16 (4.66–8.04)) | 4.97 (3.77–6.38) | 0.001* |
| GP19 | Percentage of FA2BG2S1 glycan in total IgG glycans |
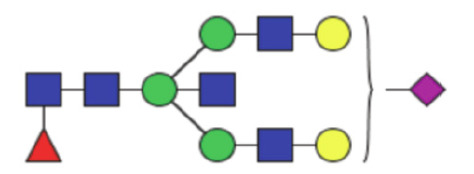
|
0.62 (0.38–0.86) | 0.61 (0.46–0.78) | 0.24 |
| GP20 | Glycan structure not clearly determined | 0.13 (0.082–0.17) | 0.11 (0.083–0.15) | 0.057 | |
| GP21 | Percentage of A2G2S2 glycan in total IgG glycans |

|
0.45 (0.30–0.69) | 0.33 (0.21–0.58) | 0.022* |
| GP22 | Percentage of A2BG2S2 glycan in total IgG glycan |
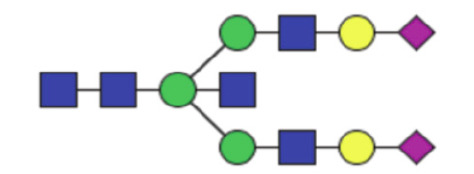
|
0.094 (0.063–0.14) | 0.11 (0.069–0.20) | 0.14 |
| GP23 | Percentage of FA2G2S2 glycan in total IgG glycans |
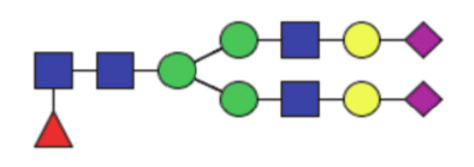
|
0.20 (0.10–0.40) | 0.18 (0.12–0.38) | 0.83 |
| GP24 | Percentage of FA2BG2S2 glycan in total IgG glycans |
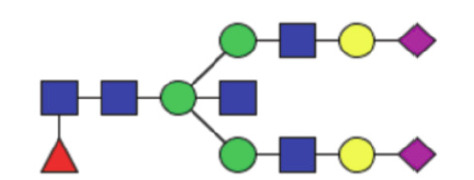
|
0.22 (0.084–0.52) | 0.23 (0.13–0.52) | 0.60 |
P values were adjusted for age and BMI. P values <0.05 are marked with “*”. B, bisecting GlcNAc; F, core fucose; G, galactose; S, sialic acid; GP, glycan peak; EC, endometrial cancer.
