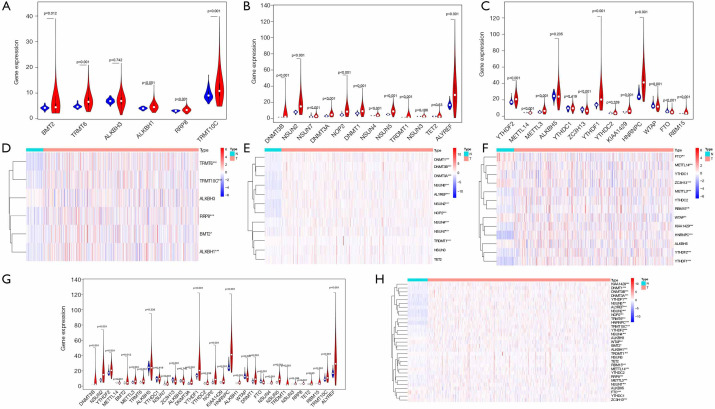
Figure 1.
Expression of RNA methylation regulators in TCGA database. (A,D) The expression levels of each m1A RNA methylation regulators. (B,E) The expression levels of each m5C RNA methylation regulators. (C,F) The expression levels of each m6A RNA methylation regulators. (G,H) The expression levels of all RNA methylation regulators. *, P<0.05; **, P<0.01 and ***, P<0.001. TCGA, The Cancer Genome Atlas.

