Figure S2.

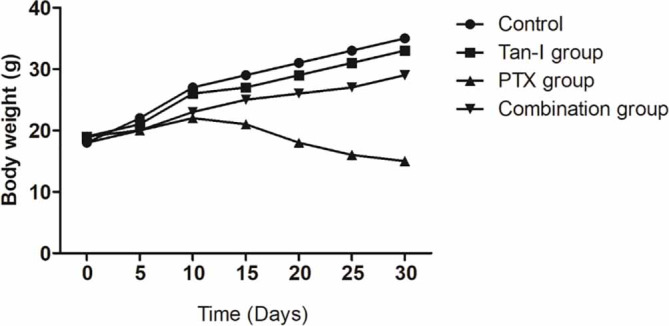
The body weight of bearing tumor mice in the control group, Tan-I group, PTX group, and combination group. Data are presented as the mean ± SD of three independent experiments.

The body weight of bearing tumor mice in the control group, Tan-I group, PTX group, and combination group. Data are presented as the mean ± SD of three independent experiments.