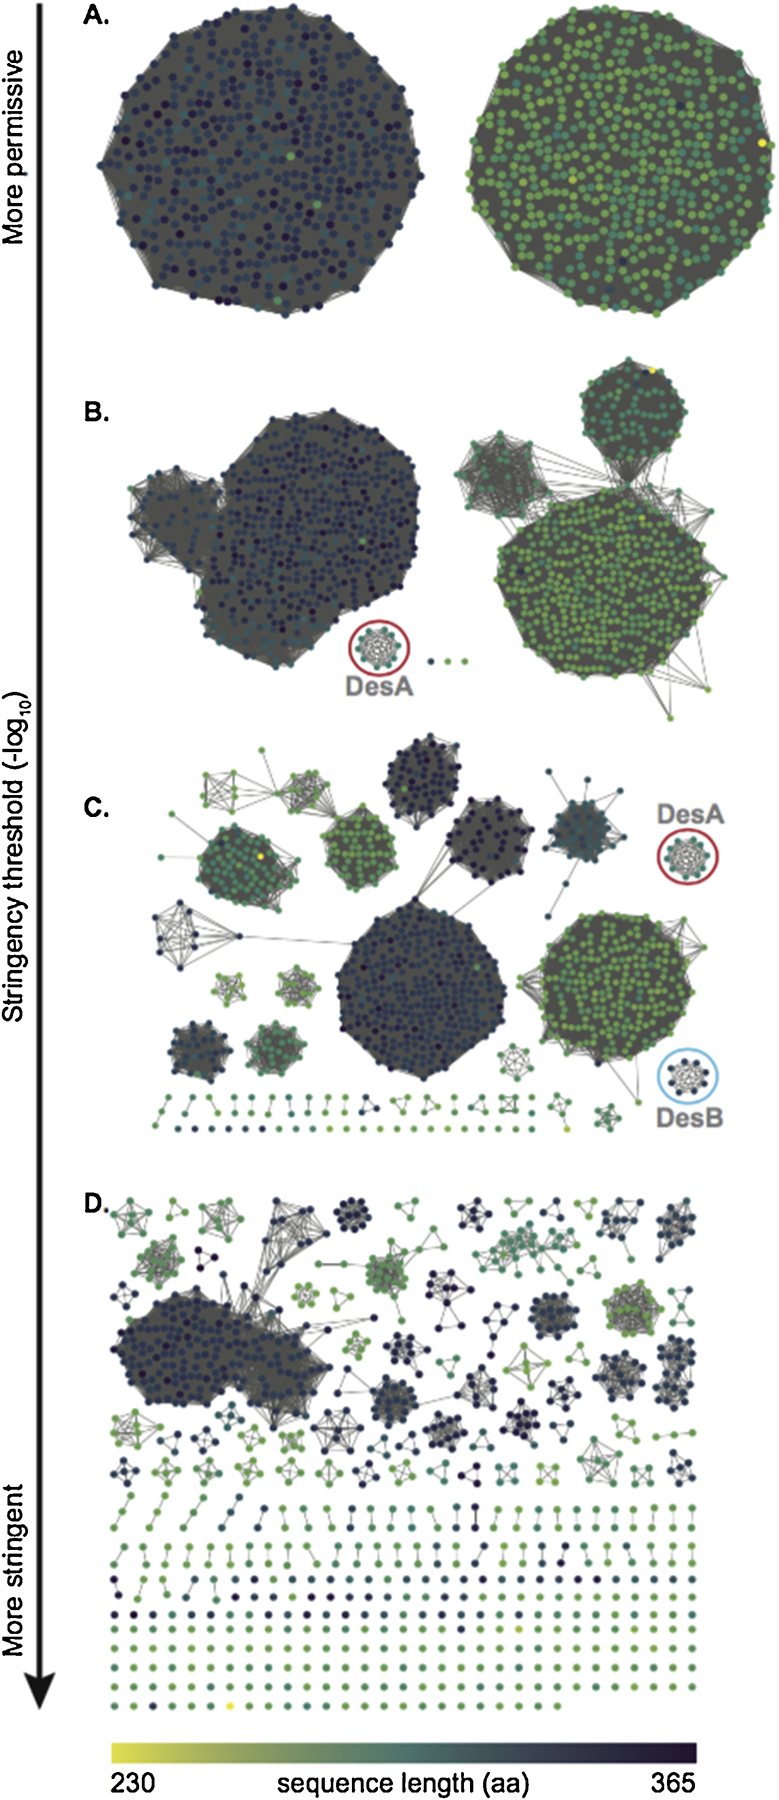
Figure 2. Thresholded sequence similarity networks represent sequences as nodes (circles) and pairwise sequence relationships (alignments) better than a set threshold as edges (lines).

As the threshold becomes more stringent, sequences break up from the main cluster. Nodes have been colored according to sequence length in amino acids (scale at the bottom). A: At threshold values below 50, proteins sequence are divided in two main clusters. B: At a threshold value of 75, the first group of sequences becomes independent from the main clusters. This group (red circle) contains proteins from the DesA family. C: At a threshold value of 100, there is a clear separation into multiple groups. Proteins from the DesA family remain clustered (red circle), and proteins from the DesB family are separated into their own cluster (cyan circle). D: At threshold values above 150, the majority of sequences break up into disconnected groups.
