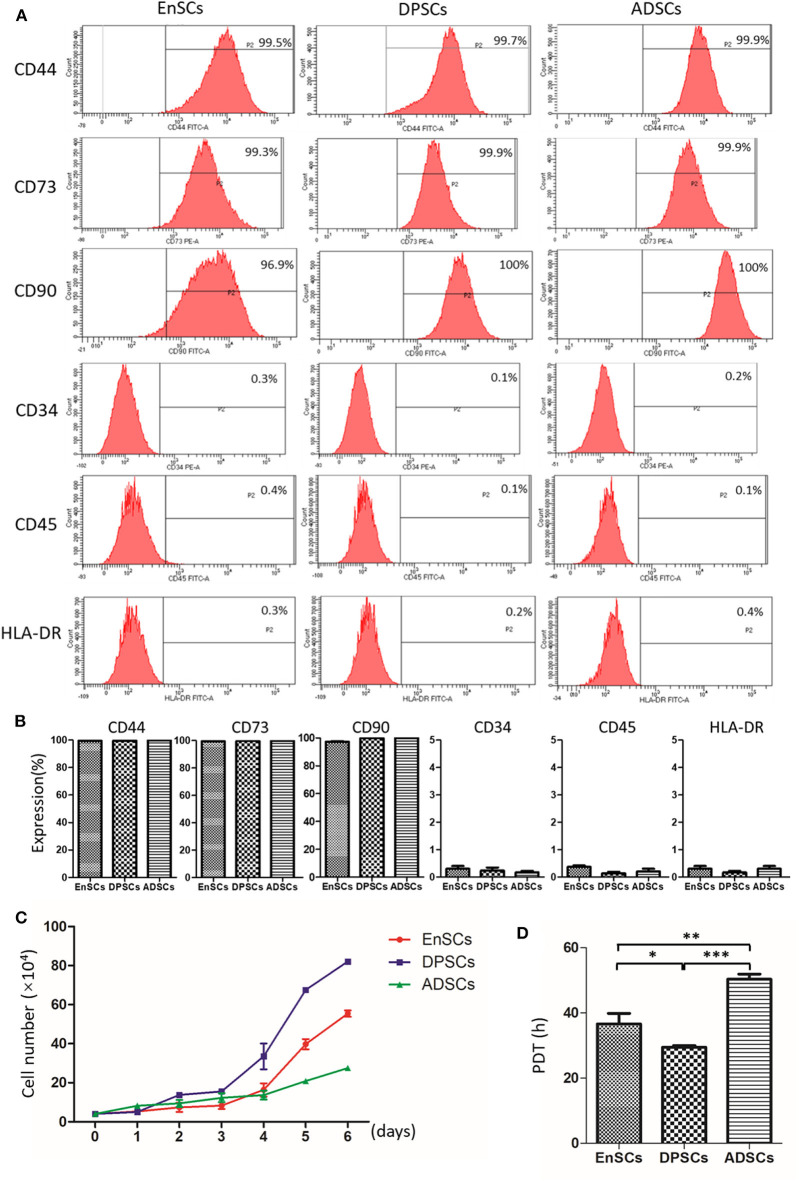
Figure 3.
Immunophenotype and proliferative potential of hEnSCs, hDPSCs and hADSCs. (A,B) Flow cytometric analysis of the expression of surface markers on MSCs. Shown (A) is one representative of 3 independent experiments. (C) Growth curves of MSCs (n = 3 donors). (D) PDT of MSCs from different types were analyzed and compared (*p < 0.05, **p < 0.01, ***p < 0.0001).

