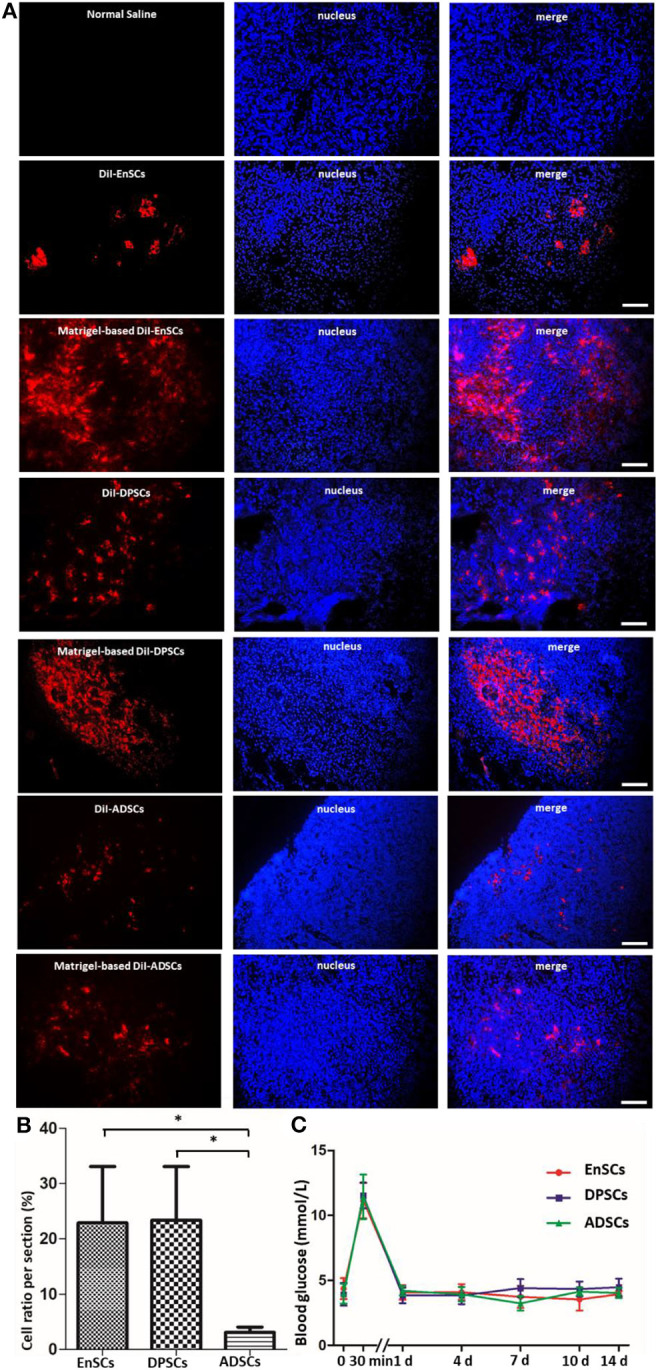
Figure 5.

MSCs from three sources at day 14 post orthotopic injection into pancreatic parenchyma of SD rats. (A) Representative fluorescence micrographs of cryo-sections in the EnSCs (upper panel), DPSCs (middle panel) and ADSCs (bottom panel) engraftment groups 14 days after orthotopical transplantation into pancreatic parenchyma of SD rats, respectively. DiI fluorescence, red; DAPI fluorescence, blue. Scale bar = 20 μm. (B) The average ratios of Matrigel-based CM-DiI-labeled cells counted in the pancreatic cryo-sections. Shown in the histogram were the percentages of Matrigel-based CM-DiI-labeled MSCs in the three groups compared to the total nuclei. *p < 0.05. (C) Blood glucose levels in SD rats transplanted orthotopically with Matrigel-based hEnSCs, Matrigel-based hDPSCs, and Matrigel-based hADSCs. Shown are the average blood glucose levels of the tail tip measured and plotted for each time point.
