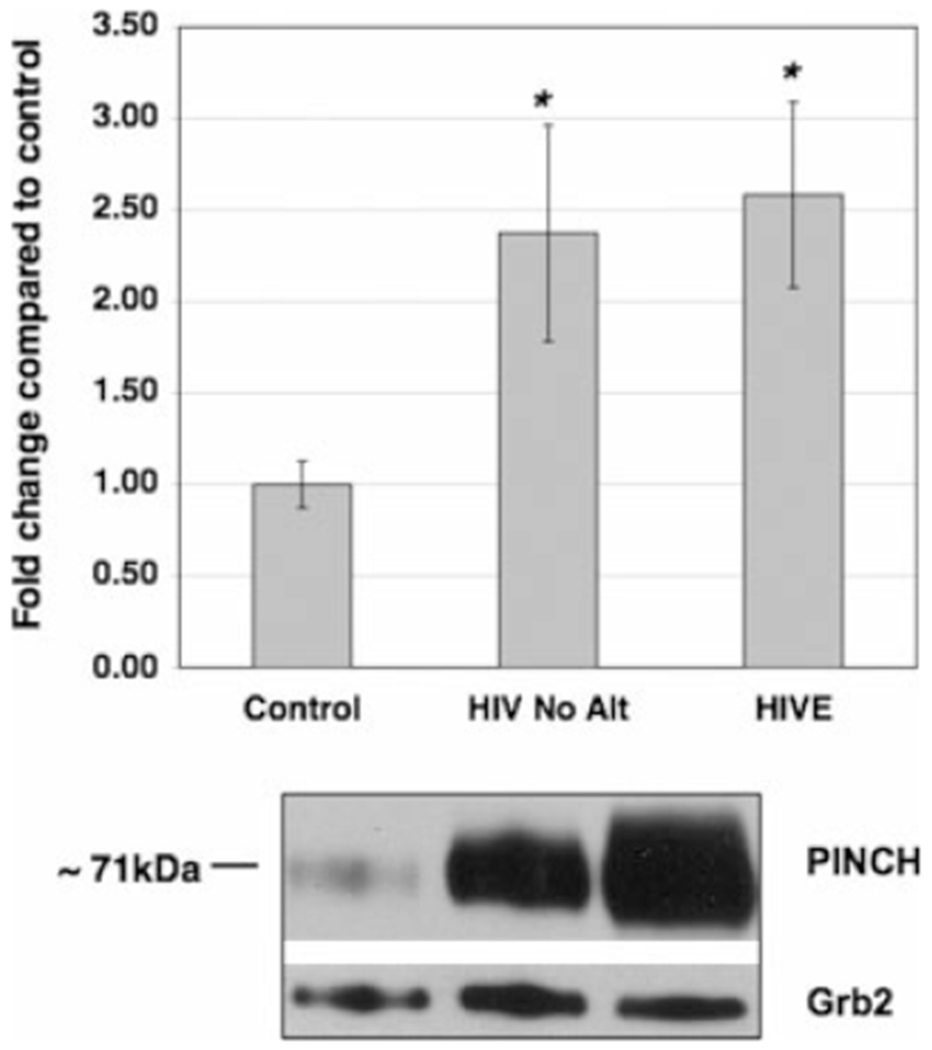
Fig. 2.

Western analyses of PINCH levels in brain tissue from HIVE patients, HIV patients with no CNS alterations, and non-HIV controls. PINCH protein levels in the brains of HIV patients with no CNS alterations (n = 10; HIV No Alt) and HIVE (n = 14) were significantly greater than levels in non-HIV patients (n = 10; Control; *P < 0.05 and 0.01, respectively) by one-way ANOVA with Dunnett’s post hoc test compared with untreated control. The lower panel is a representative Western blot of brain homogenate reacted with anti-PINCH antibody detecting a band at 71 kDa that corresponds to PINCH dimer. Grb2 was used as a loading control.
