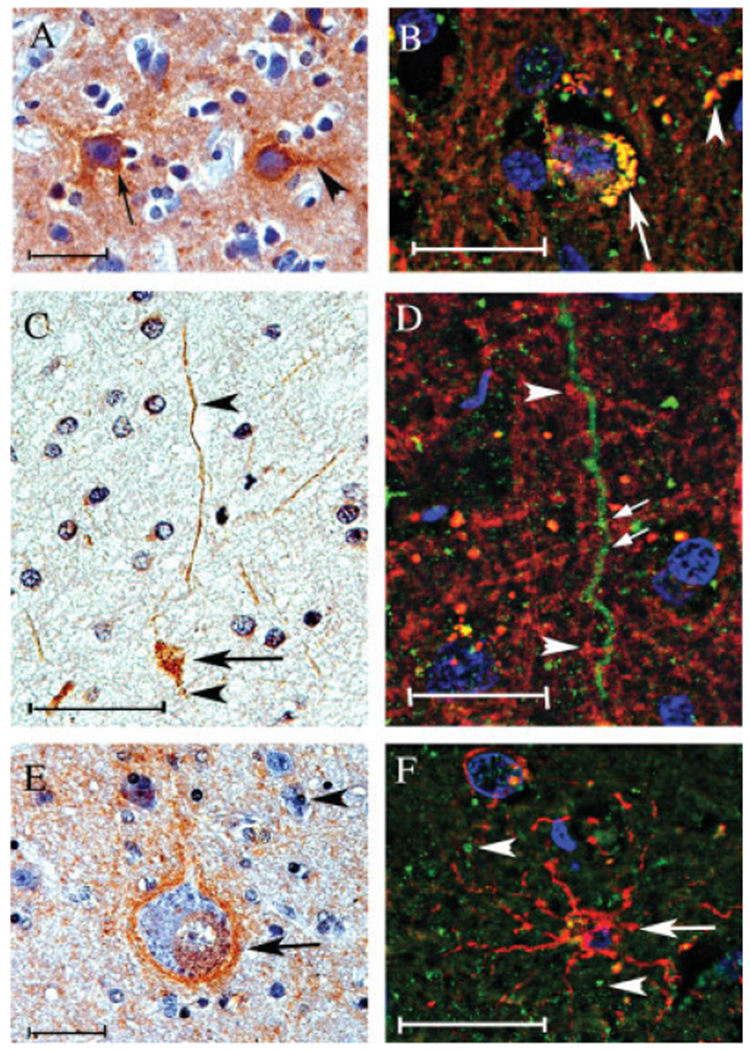
Fig. 5.

Double-immunofluorescence analyses of PINCH cellular localization in the frontal cortex of HIV patients. A, C, and E are reacted with anti-PINCH antidody and counterstained hematoxylin. B, D, and F are doubly labeled with anti-PINCH antibody (green) and antineurofilament, antimyelin basic protein, or anti-GFAP, (red, respectively). A: PINCH immunoreactivity (brown) is observed in neuronal cell bodies (arrow) and in neuronal processes (arrowhead) in an HIVE brain. B: Neuronal cells displayed both PINCH (green) and neurofilament (red) immunoreactivity, with colocalization (yellow) observed in neuronal cell bodies (arrow) and in neuronal processes (arrowhead). C: PINCH (brown)-immunoreactive neuronal cell bodies (arrow) and processes (arrowhead). D: Neuronal cell processes displayed PINCH immunoreactivity with a punctate, beadlike pattern (arrows, green) but did not colocalize with the surrounding myelin basic protein (red). E: Neuronal cell body and process displaying PINCH immunoreactivity (arrow, brown) surrounded by astroglial cell nuclei (arrowhead). F: Astroglial cell labeled with GFAP (red) showing no colocalization with PINCH (green). Scale bars = 10 μm.
