Fig. 4.

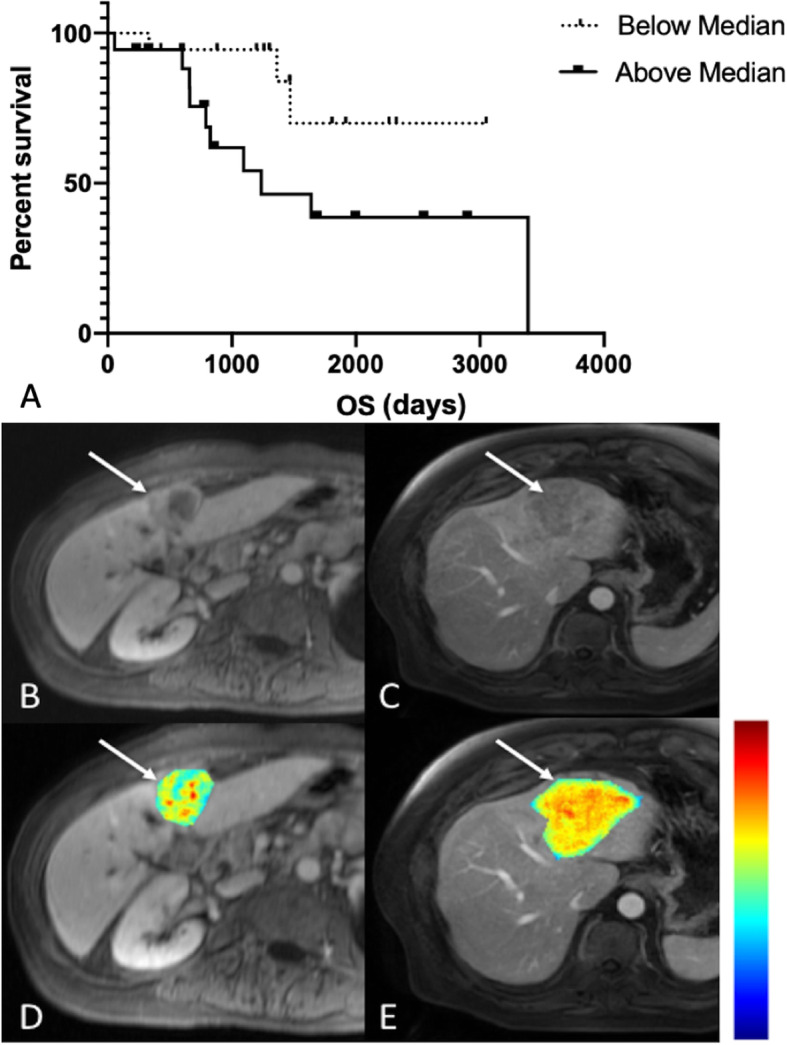
MRI texture feature information measure of correlation 1 found to be a significant predictor of OS on univariable analysis. Kaplan-Meier curve for OS as a function of whether MRI information measure of correlation 1 was above (solid line) or below (dashed line) its median value of − 0.458 (a). 68-year old female with poorly differentiated ICC in segment 4 (AJCC stage 3) on T1-weighted post-contrast MR image obtained during portal venous phase (b, arrow) with an overlying information measure of correlation 1 texture map (d, arrow). This patient’s information measure of correlation 1 was calculated to be − 0.554 (scale − 1.0-0.0, blue-red), with corresponding OS of 1259 days. 63-year old male with moderately differentiated ICC in segment 4A/2 (AJCC stage 3) on T1-weighted post-contrast MR image obtained during portal venous phase (c, arrow) with an overlying information measure of correlation 1 texture map (c, arrow). This patient’s information measure of correlation 1 was calculated to be − 0.330 (scale − 1.0-0.0, blue-red), with corresponding OS of 658 days. Color scale bar is shown on the right
