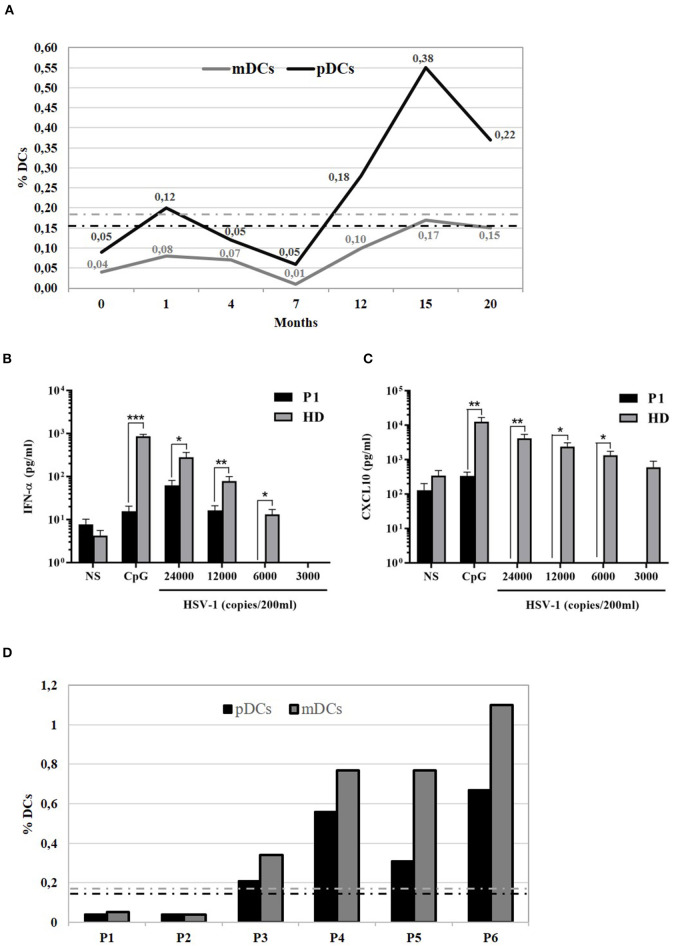
Figure 2.
Functional analysis of 818del4 mutated IFNγR1 and study of patient's DCs. (A) Percentage of plasmacytoid dendritic cells (%pDCs) and myeloid dendritic cells (%mDCs) in P1 in timing (months) of therapy and follow-up (the dotted lines indicate the normal values, gray-colored for mDCs and black-colored for pDCs). IFN-α (B) and CXCL10 production (C) are measured in triplicate, by freshly isolated PBMCs after stimulation for 24 h with 6 mg/ml CpG, HSV-1 (copies/200 ml), or medium alone, in the patient (P1) and a healthy donor (HD). Statistical analysis by non-parametric test shows a significant difference (*p < 0.05, **p < 0.01, ***p < 0.001). (D) Plasmacytoid dendritic cells (%pDCs) and myeloid dendritic cells (%mDCs) are analyzed in other patients with mycobacterial infection: P2 has AD partial IFNγR1 deficiency and had acute mycobacterial infection during the evaluation of flow cytometry, while P3 has AD partial IFNγR1 deficiency but blood was collected when he was free of infection; P4, P5, and P6 presented a mycobacterial infection without any identified predisposing genetic cause (the dotted lines indicate the normal values, gray-colored for mDCs and black-colored for pDCs).

