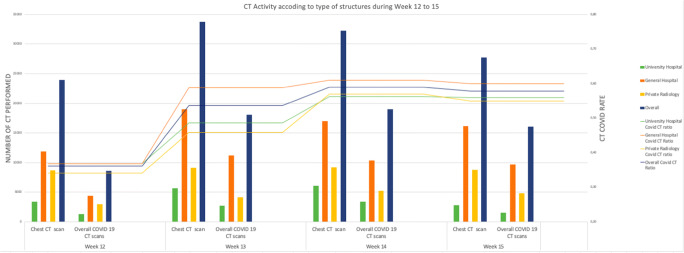
Fig. 2.
The variation of the CTcovid rate during the study within the three types of radiology centers. The histogram illustrates the quantitative numbers of CT performed. The lines illustrate the variation of the mean COVID CT rate among the three types of radiology centers. The number of CTchest and COVID CTcovid seemed to evolve during the study according to the type of centers, whereas in the university hospital, the highest activity was recorded on week 13, it was on week 14 for the public hospital, and on week 15 for the private structure

