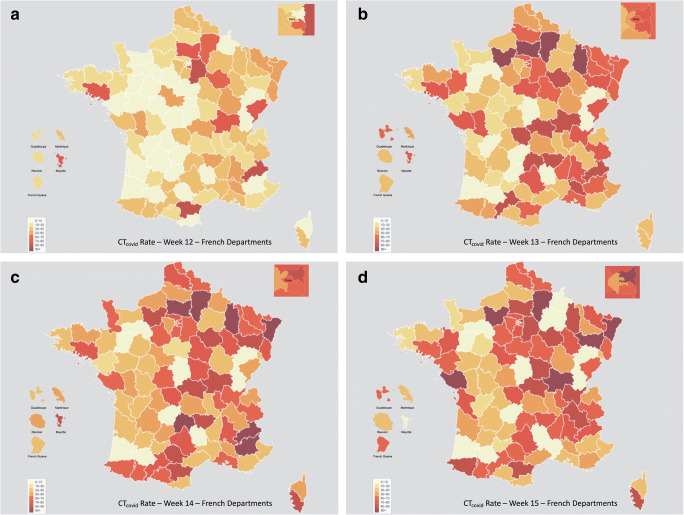
Fig. 3.
Graphic analysis of the COVID-19 in France during the study using choropleth maps. a–d COVID CT rate in France using administrative area as unit according to time. A red unit represents a high COVID-19 CT rate level and a yellow unit a low level. COVID CT rate is highest in the north and east of France and diffused during the 4 weeks of the study. Considering that the epidemic peak was on the week 13, COVID CT rate remains high during the 4 weeks of the study. a CTcovid rate for week 12. b CTcovid rate for week 13. c CTcovid rate for week 14. d CTcovid rate for week 15

