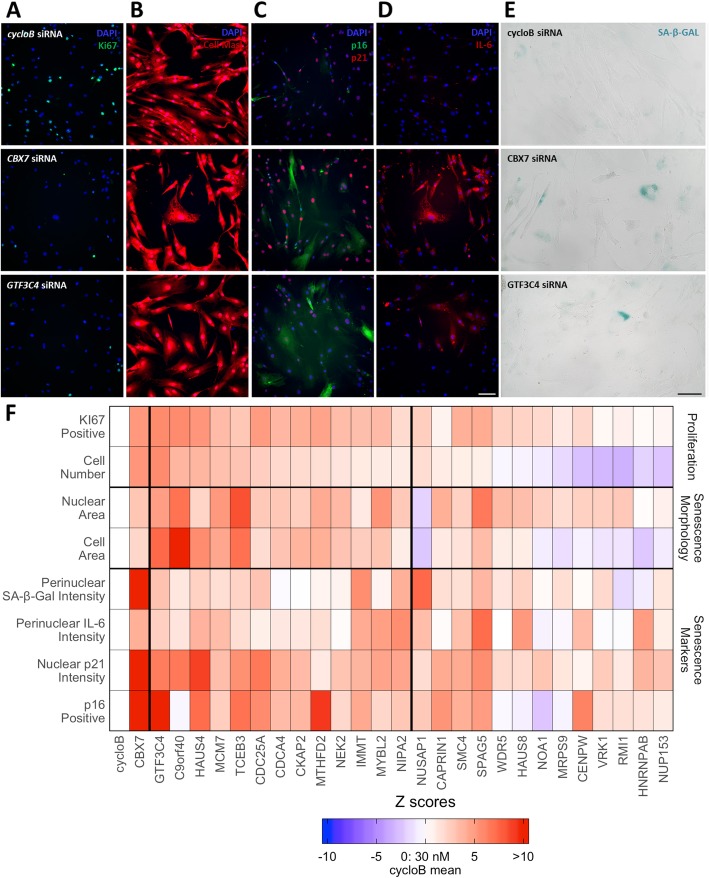
Fig. 5.
Experimental validation of 26 senescence candidates. a–e Representative images of fibroblasts following transfection with cyclophilin B siRNA (top row), CBX7 siRNA (middle row), or GFT3C4 siRNA (bottom row). a DAPI (blue) and Ki67 (green). b DAPI (blue) and Cell Mask (red). c DAPI (blue), p16 (green) and p21 (red). d DAPI (blue) and IL-6 (red). e Brightfield images following staining for SA-β-galactosidase. Size bar, 100 μm. f Heatmap of multiparameter analysis of proliferation markers (cell number and % Ki67 positive), senescence-associated morphology (cellular and nuclear area) and senescence markers (% p16 positive, p21 intensity, perinuclear IL-6 and perinuclear SA-β-galactosidase). Colors illustrate the number of Z-scores the experimental siRNA is from the cyclophilin B (cycloB) negative control mean. Data are ranked by whether or not the siRNA is a top hit (siRNAs between the thick horizontal lines), and then by the cell number Z-score. Red values indicate Z-scores that are “senescence-associated measures.” The CBX7 positive control is also shown for comparison. Data presented are from at least two independent experiments each performed with a minimum of three replicates. All Z-scores are available in Additional file 1: Table S44

