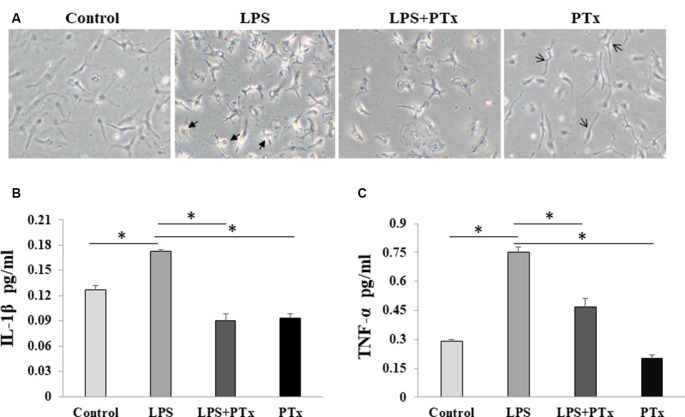
Figure 4.
PTX reduced microglial cytokine release in response to LPS stimulation. (A) Representative images of cultured microglia at the time of harvest at 24 h. Two kinds of arrows indicate the distinct large amoeboid (thick arrow symbol) and long spread body cells (thin arrow symbol) and long spread body cells. (B) ELISA quantification of IL-1β in conditioned media. (C) ELISA quantification of TNF-α in conditioned media (*P < 0.05).

