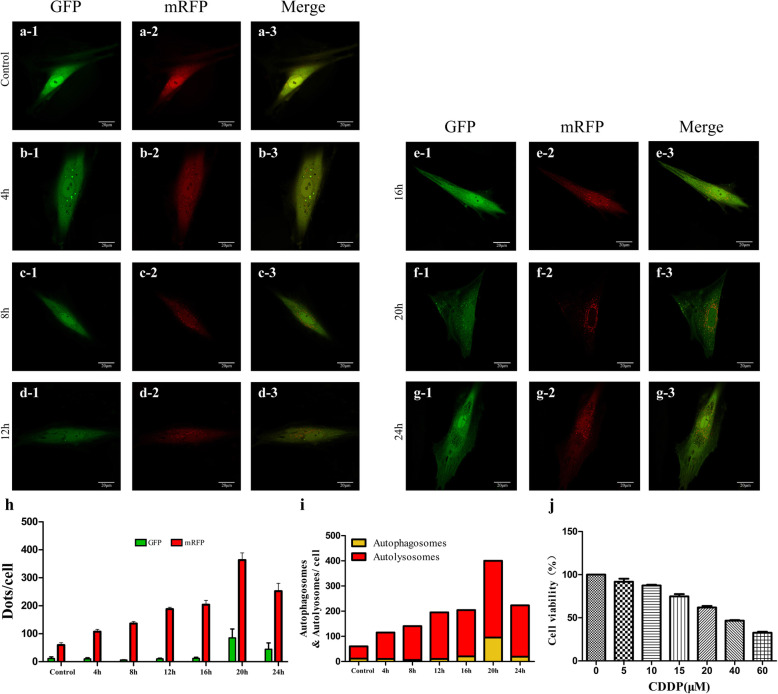
Fig. 3.
Effect of CDDP on autophagy and cell viability of TICs. a–g Representative fluorescence images of mRFP-GFP-LC3 at different exposure times from 4 to 24 h—green fluorescent with GFP staining and red fluorescence with mRFP staining. h Summary of dot distribution per cell from GFP and mRFP staining. i Average number of autolysosomes as indicated by red dots only and autophagosomes with both red and green dots within cells. j Cell viability of TICs as a function of treatment with varying CDDP concentrations. Data are expressed as the means ± SD. CDDP, cisplatin; TICs, theca-interstitial cells

