Figure 4.
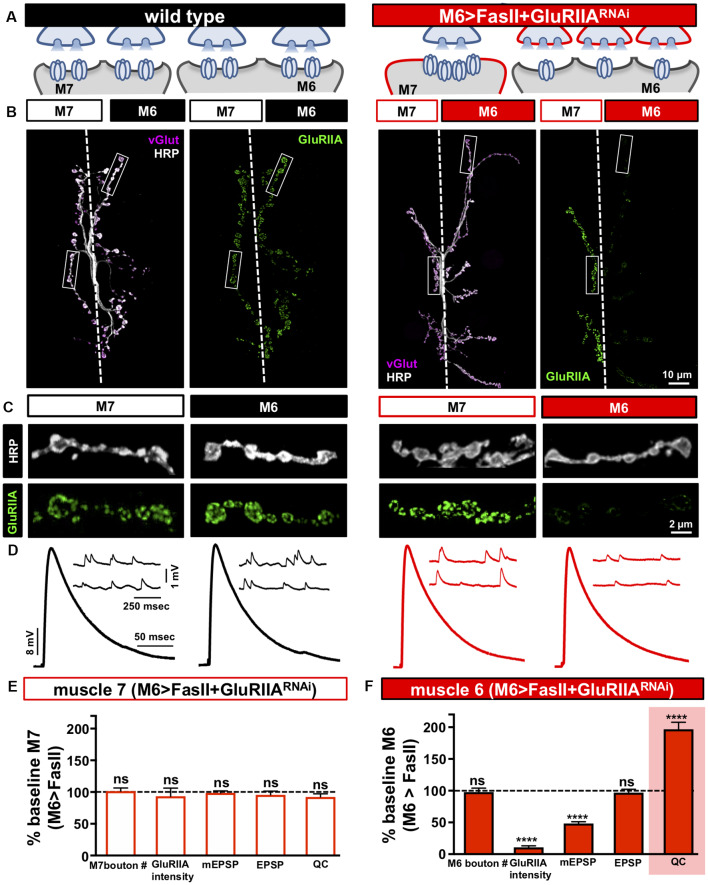
Distinct target-specific adaptations balance hyper-innervation and GluR loss. (A) Schematic illustrating the dual manipulation used to both bias innervation and inhibit GluRIIA expression specifically on muscle 6 (M6 >FasII+GluRIIARNAi: w;Tub-FRT-STOP-FRT-Gal4, UAS-FLP, UAS-CD8-GFP; H94-Gal4, nSyb-Gal80/UAS-FasII; UAS-GluRIIARNAi). (B) Representative images of muscle 6/7 NMJs from the indicated genotypes immunostained with anti-HRP, -vGlut, and -GluRIIA. (C) Individual boutons from selected areas (white rectangles) of NMJs shown in (B). Note the enhanced GluRIIA levels on hypo-innervated muscle 7 with a loss on hyper-innervated muscle 6. (D) Electrophysiological traces of recordings from muscles 7 and 6 in the indicated genotypes. EPSP amplitudes on muscle 7 and 6 in M6 >FasII+GluRIIARNAi are similar to wild-type values. (E) Quantification of bouton numbers, GluRIIA puncta intensity, mEPSP amplitude, EPSP amplitude, and quantal content on muscle 7 in M6 >FasII+GluRIIARNAi. All values are normalized to baseline (M6 >FasII muscle 7); no significant differences are observed. (F) Quantification of all values in (D) on muscle 6 of M6 >FasII+GluRIIARNAi normalized to baseline (M6 >FasII muscle 6) values. Note that while GluRIIA levels and mEPSP amplitudes are significantly reduced, EPSP amplitude remains unchanged because of a homeostatic increase in quantal content, indicating presynaptic homeostatic potentiation (PHP) expression. Error bars indicate ±SEM (n ≥ 8; Student’s t-test; Supplementary Table S2). ****p < 0.0001; ns, not significant.

