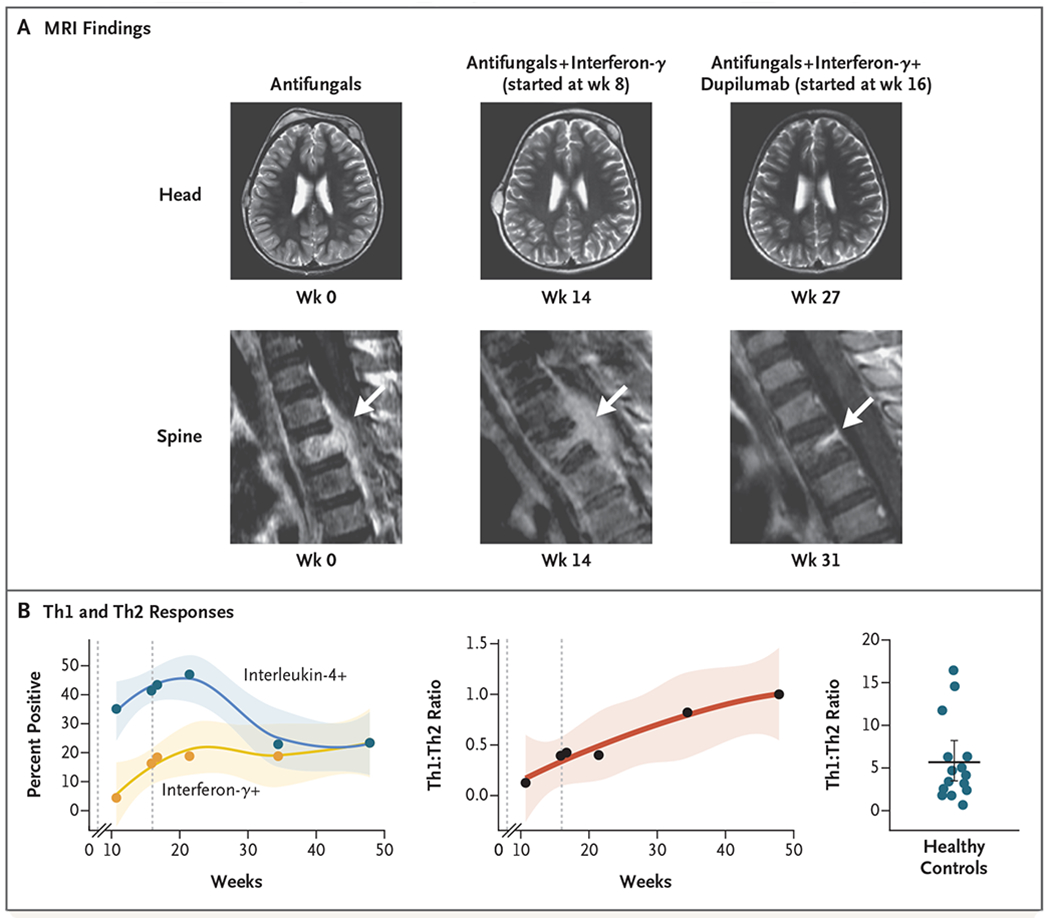
Figure 2. Resolution of Disseminated Coccidioidomycosis after Treatment with Interferon-γ and Dupilumab.

Panel A shows magnetic resonance imaging (MRI) of the head and spine at baseline and during treatment. A spinal lesion is indicated by the arrow. Panel B shows the percentage of CD4+ T cells producing interferon-γ (Th1 cells) or interleukin-4 (type 2 helper T [Th2] cells) (left) and their ratio (center) over time. The ratio does not include doublepositive (i.e., positive for interferon-γ and interleukin-4) cells. The first dashed line represents the initiation of interferon-γ treatment, and the second dashed line represents the initiation of dupilumab treatment. Shading indicates the 95% confidence interval. For comparison, the Th1:Th2 ratio for 15 healthy controls is shown on the right. The horizontal line indicates the bootstrapped mean, and the I bar indicates the 95% confidence interval.
