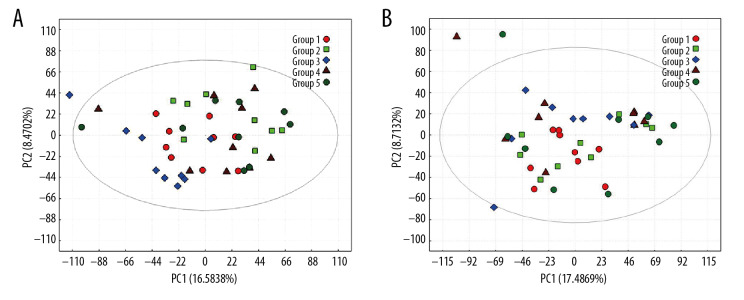
Figure 1.
PCA scores for metabolic pattern to visualize group clustering between perioperative liver transplantation and NC samples. PCA score plots of serum samples collected from NC (group 1), Pre (group 2), P1 (group 3), P3 (group 4), and P7 (group 5) groups in negative ion mode (A) and positive ion mode (B). The sample clusters of negative ion mode were tighter than those of positive ion mode, and no extreme outliers were observed.

