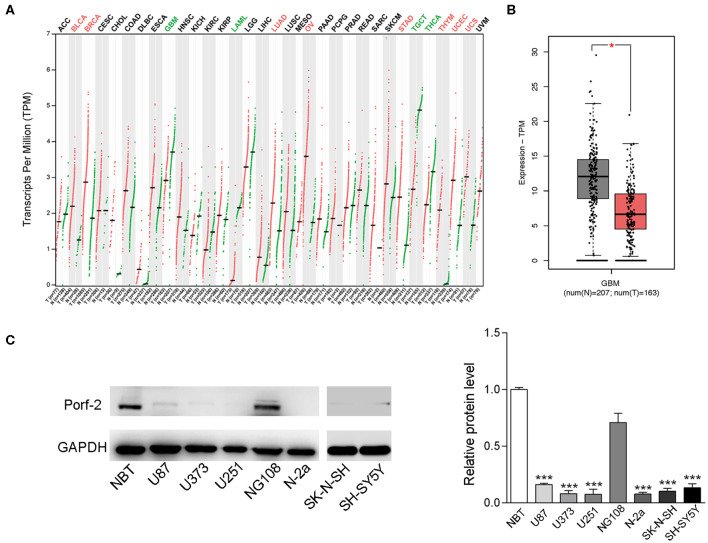
Figure 1.
Porf-2 expression is decreased in both neuroblastoma and glioma cell lines. (A) Porf-2 expression levels were analyzed in several tumors from the TCGA database. All the abbreviations of the cancer name can be found on the TCGA website. https://gdc.cancer.gov/resources-tcga-users/tcga-code-tables/tcga-study-abbreviations.The cancer names in black indicate that there is no differential expression between the cancer type tumor and its adjacent or normal tissue, red indicates that it is upregulated in the tumor tissue, and green indicates that it is downregulated in the tumor tissue. On the horizontal axis, T represents the tumor, n represents the control, the number n in parenthesis represents the corresponding sample number. (B) The box plot of the TCGA database indicates that Porf-2 expression is downregulated in glioma. (C) The expression of Porf-2 in neuroblastoma and glioma cell lines were detected and quantified by western blotting. NBT represents normal brain tissue. Error bars represent ± SEM; *P < 0.05, ***P < 0.001.

