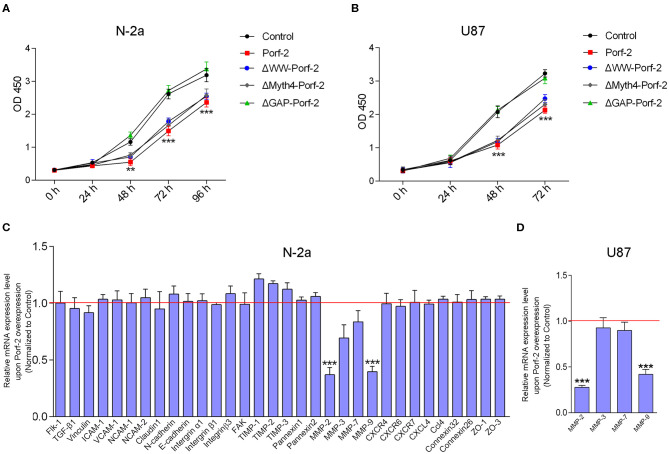
Figure 4.
Porf-2 inhibits tumor cell migration through MMPs. (A) CCK-8 assays were performed to analyze the proliferation of N-2a cells in different groups. (B) CCK-8 assays were performed to assess the proliferation ability of U87 cells in different groups. Error bars represent ± SEM; **P < 0.01, ***P < 0.001 vs. the control group. (C) Real-time PCR analysis was performed to explore the relative mRNA expression of the potential target genes after Porf-2 overexpression in N-2a. The relative mRNA level was normalized to the control. The red line indicates the normalized control group. (D) Real-time PCR was performed to verify the downexpression of MMPs after Porf-2 overexpression in U87 cells. The relative mRNA level was normalized to the control. The red line indicates the normalized control group. Error bars represent ± SEM; **P < 0.01, ***P < 0.001 vs. the control group.

