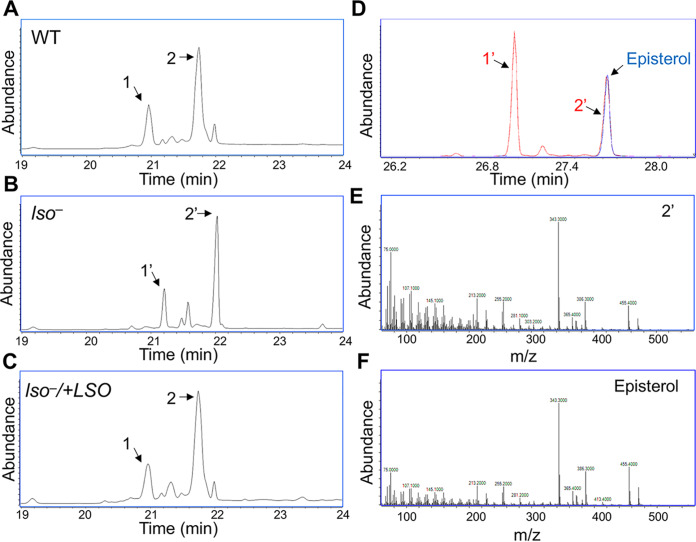
FIG 2.
GC-MS analyses of sterol TMS derivatives show altered sterol profile in lso− mutants. (A to C) Total ion current chromatograms plotted from 19.0- to 24.0-min scans (mass range, m/z 50 to 550) of the sterol TMS derivatives of LV39 WT (A), lso− (B), and lso−/+LSO (C) strains. In panels A and C, peaks 1 and 2 represent ergosterol and 5-dehydroepisterol, respectively. In panel B, the peaks including 1′ and 2′ are shifted to the right. (D) The reconstructed ion chromatogram of the M+ ion (m/z 470.5) from full GC-MS scans (m/z 50 to 550) of the lso− sample (trace in red) and from the episterol standard (trace in blue). In addition to the perfect match of the retention time of peak 2′ with the episterol standard, the full-scan EI mass spectra (70 eV) plotted from peak 2′ (E) and the episterol standard (F) are also identical, confirming that peak 2′ is episterol.

