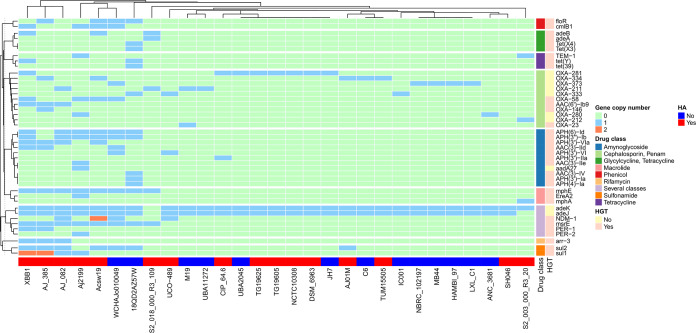
FIG 2.
Antibiotic resistance genes in A. johnsonii. ARGs in A. johnsonii were predicted in silico. A heat map shows the frequency of ARGs in the A. johnsonii isolates. Antibiotic classes are color-coded. A dendrogram at the top of the figure shows a hierarchical clustering analysis of the strains according to ARG presence. Next to the drug class column, there is a column (HGT key) specifying whether the ARG had identical sequences in other species (salmon) or not (yellow). The row below the heat map indicates whether (red) or not (blue) the isolates are associated with hospitals (HA key).

