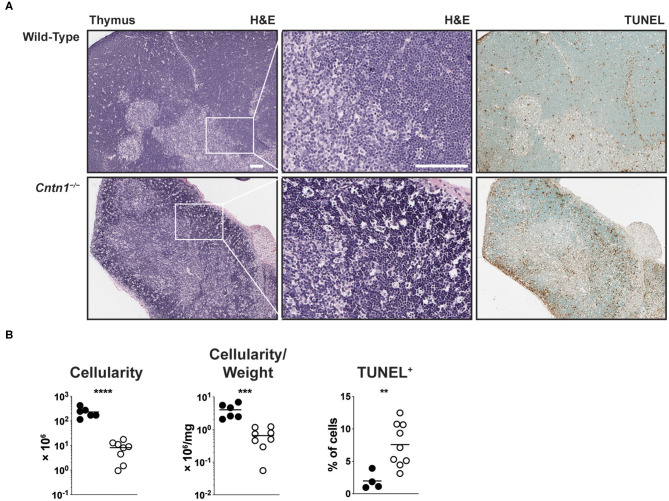
Figure 2.
Cntn1−/− animals show thymic atrophy prior to expiration. (A) Representative images of P16 thymuses from wild-type (top) and Cntn1−/− (bottom) at 4 × (H&E, upper panels; TUNEL, lower panels) or 10 × (H&E, middle panels). White scale bars represent 100 μm. (B) Graphs show thymus cellularity (left), cellularity normalized to organ weight (middle), or TUNEL+ cells (right) from individual wild-type and Cntn1−/− animals. Analysis of aggregated data by Student's t-test. **p < 0.01, ***p < 0.001; ****p < 0.0001.

