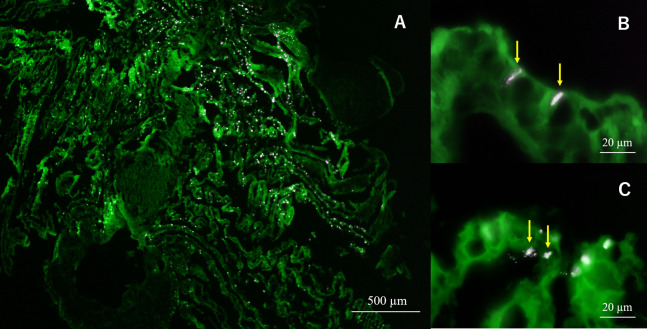
Figure 5. Micrographs of semi-thin gill sections of H. gigantea-4.
Micrographs showing the results of FISH analysis of gill sample by simultaneous application of probe TAMRA-Eps222 and FITC-Eub338. (A) ×40 micrographs; (B and C) ×1,000 micrographs. White to magenta cells showed Eps222-positive cells. The yellow arrow indicates micro-colony (100–200 cells).

