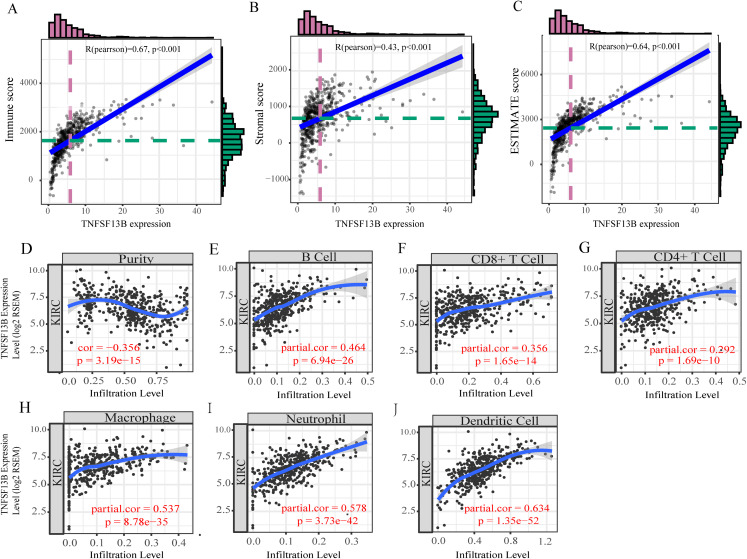
Figure 7. Tumor microenvironment exploration of TNFSF13B.
(A) Correlation scatters diagram of the immune score and TNFSF13B expression. (B) Stromal score. (C) ESTIMATE score. (D) Correlation scatters Diagram of Tumor purity and TNFSF13B expression. (E) B cell. (F) CD8+ T cell. (G) CD4+ T cell. (H) Macrophage. (I) Neutrophil and (J) Dendritic cell. A value of p < 0.05 indicates that it is statistically significant.

