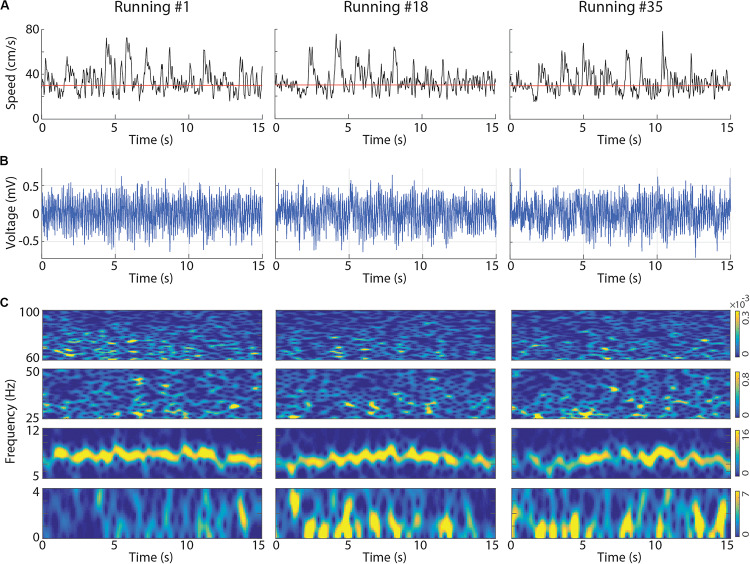
FIGURE 2.
Representative examples of instantaneous running speed and LFP signals at the first, at an intermediate and at the last treadmill running. (A) Black lines represent the instantaneous running speed and red lines represent treadmill speed (30 cm/s). The CA1 LFPs (B) and associated spectrograms (C) obtained for the same runs. In the spectrograms, delta (0–4 Hz), theta (5–12 Hz), low gamma (25–50 Hz) and high gamma (60–100 Hz) bands are shown separately to allow individual colormap scales (the scale is the same across runs). Notice the gradual reduction of theta power and the emergence of a slower LFP activity in the delta band. LFPs obtained from the dorsal CA1 of the left hemisphere (Rat2_Session2).

