Figure 4.

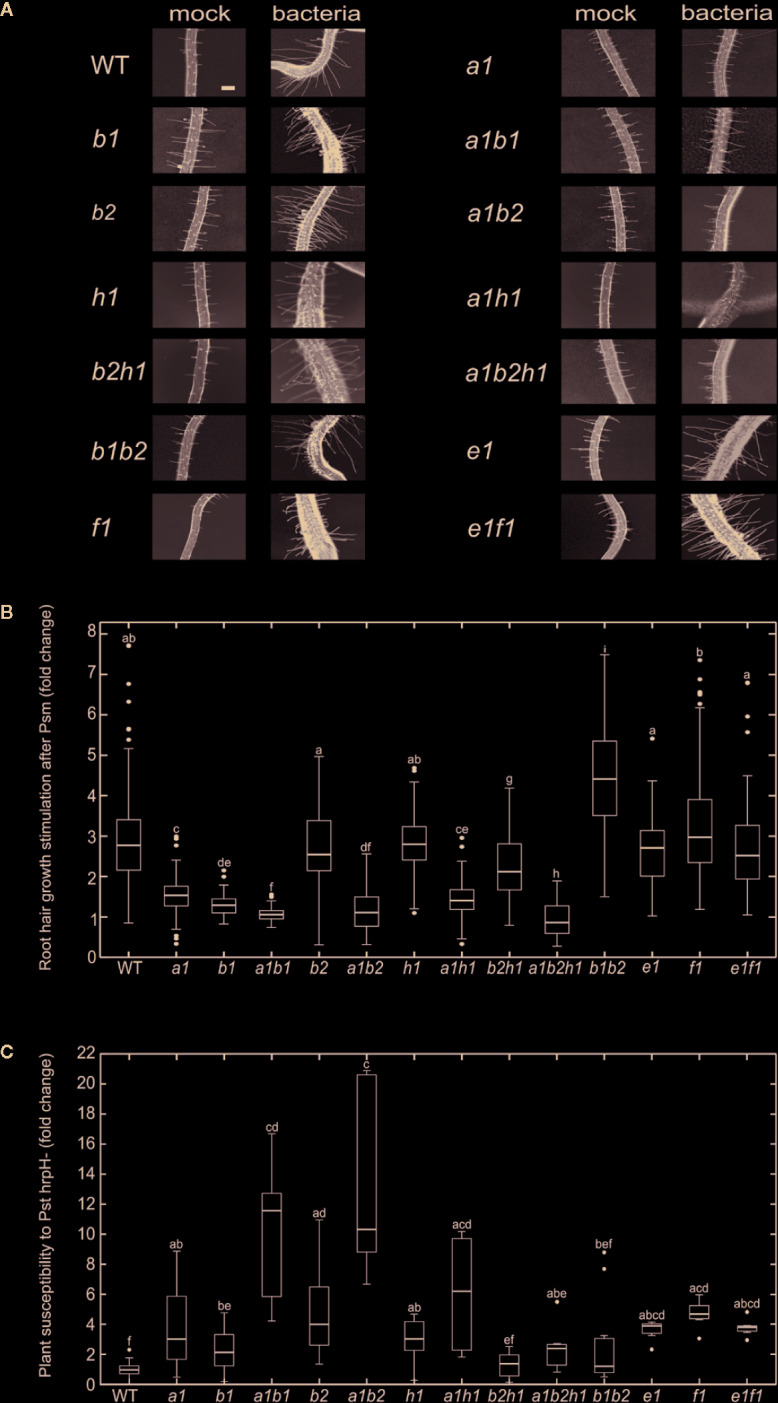
(A) Root hair growth appearance 48 h after mock or P. syringae pv. maculicola (Psm) treatment for each of analyzed lines (bar = 100 µm). (B) Root hair growth stimulation after P. syringae pv. maculicola (Psm) inoculation. For each of mutant lines root hair length is compared to mock treated control and the difference expressed as a fold change; the mock treated WT root hair size represents fold change 1; error bars—standard deviation, n = 60–407 root hairs; different letters indicate significant differences (P < 0.05). (C) P. syringae pv. tomato DC3000 hrpH− flooding inoculation. The variation in sensitivity is expressed as a fold change of CFU in comparison to the WT (fold change 1) and is presented for each of analyzed lines; error bars—standard deviation, n = 6–36 samples from three to four pooled seedlings each; different letters indicate significant differences (P < 0.05).
