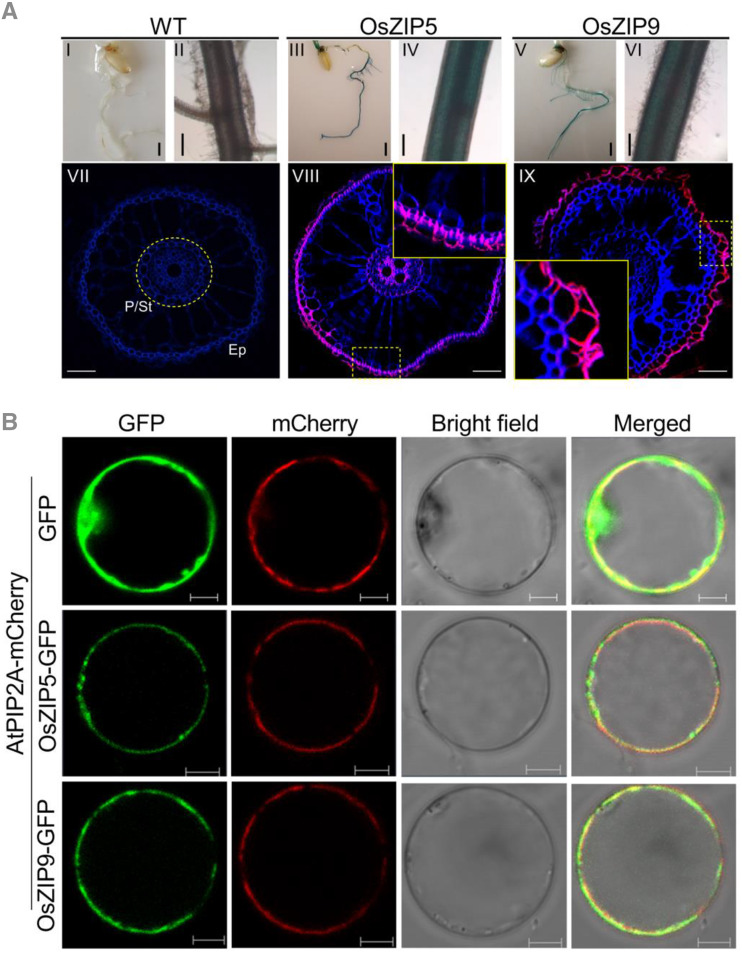
Figure 2.
Tissue specificity and subcellular localization of the OsZIP5 and OsZIP9 proteins. A, Histochemical analysis in roots of wild-type (WT; I and II) and transgenic plants expressing the GUS gene driven by the promoter regions of OsZIP5 (III and IV) and OsZIP9 (V and VI). Immunostaining with an anti-GUS antibody was performed in roots of transgenic rice plants carrying the OsZIP5 or OsZIP9 promoters fused with the GUS gene (VIII and IX) at the vegetative growth stage. Wild-type plants were used as the negative control (VII). The GUS antibody-specific fluorescent signal is shown in red. Blue indicates cell wall autofluorescence after DAPI staining. P, pericycle; St, stele; Ep, epidermis. The insets in VIII and IX represent magnifications of the regions outlined by dotted yellow lines. Scale bars = 1 mm (I–VI) and 50 μm (VII–IX). B, OsZIP5-GFP, OsZIP9-GFP, and AtPIP2A-mCherry (a plasma membrane localization marker) in rice protoplasts. For each localization experiment, ≥20 individual cells were analyzed using a Zeiss LSM880 confocal laser-scanning microscope (Carl Zeiss). Scale bar = 10 μm.

