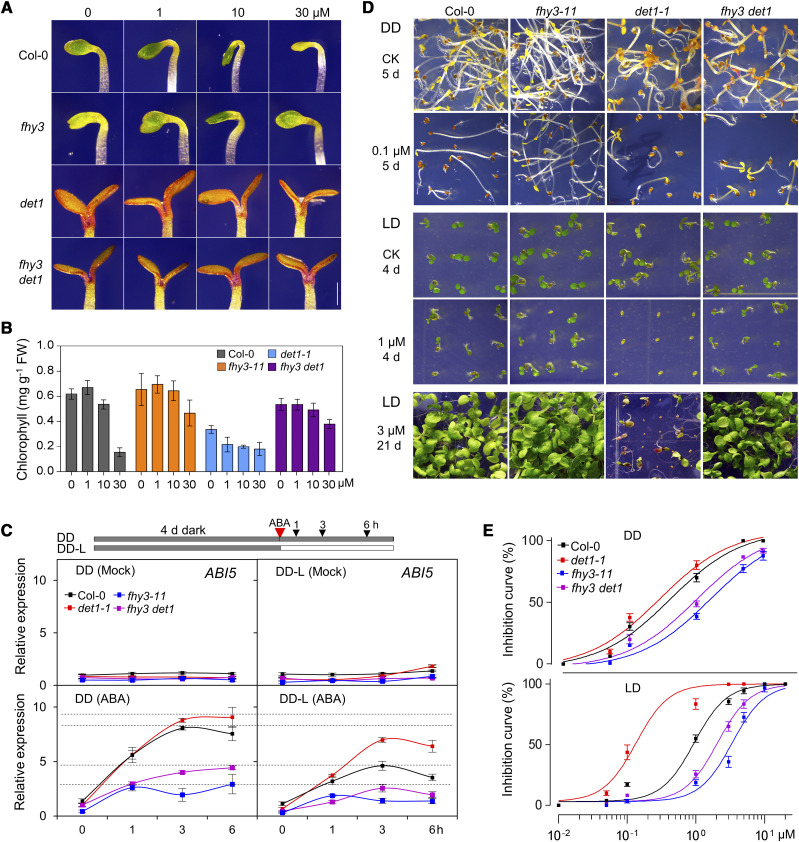
Figure 3.
FHY3 acts downstream of DET1 in mediating ABA responses. A and B, The greening phenotype (A) and chlorophyll contents (B) of 4-d-old various etiolated seedlings treated with 0, 1, 10, or 30 μm of ABA for 4 h under light conditions. FW, Fresh weight. Scale bar = 1 mm. Values are means ± sd. C, RT-qPCR analyses showing the relative expression of ABI5 in various seedlings. Four-day-old various etiolated seedlings were treated without (Mock) or with 30 μm of ABA for the indicated times under DD or after being transferred to light conditions (DD-L). A typical experiment out of three repeated experiments is shown, and means are values ± sd of three technical replicates are presented. D, Phenotypes of various plants germinated and continuously grown on GM without or with 0.1 μm of ABA under DD for 5 d, with 1 μm of ABA under LD for 4 d, or with 3 μm of ABA under LD for 21 d. E, The ABA inhibition response curves of seed germination for various plants under DD (upper) or LD (lower) conditions. ABA inhibition curves were calculated based on the inhibition effect of ABA on germination at the time point that ∼50% wild-type seeds germinated under 1 μm of ABA treatment (at 60 h after imbibition under LD; at 72 h after imbibition under DD, respectively) using the EC50 shift. Values are means ± sd.

