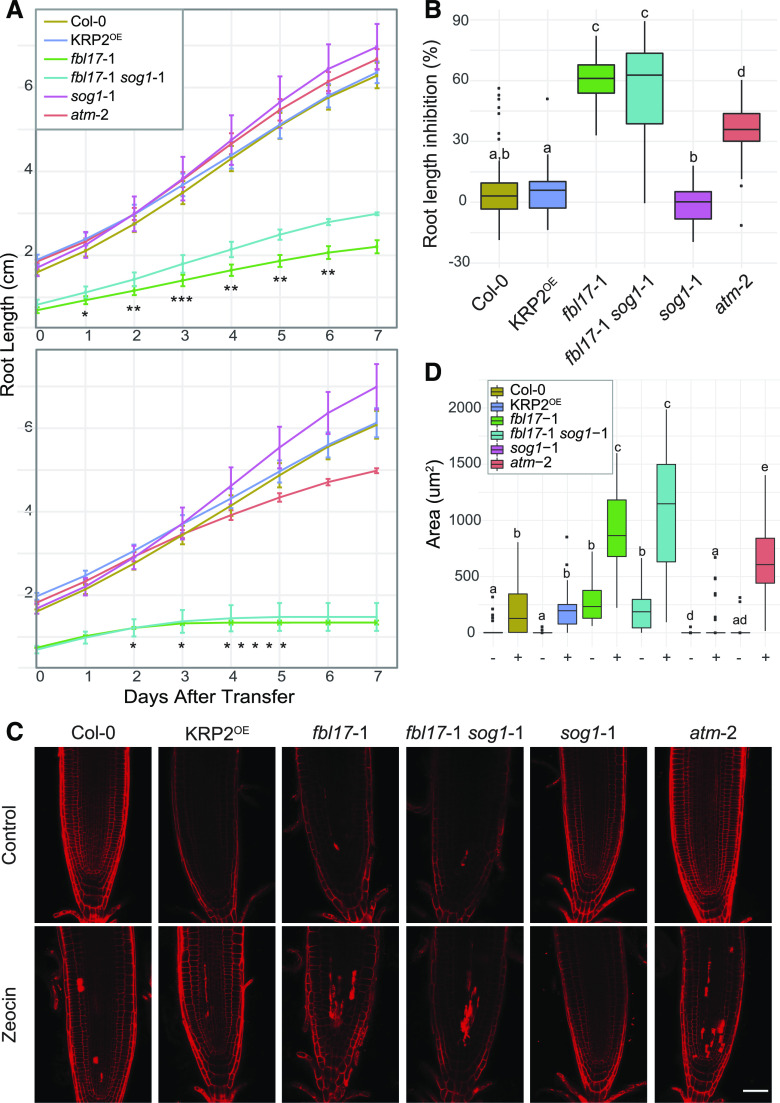
Figure 4.
The fbl17 mutant exhibits hypersensitivity to zeocin treatment. A, Root growth elongation of the indicated genotypes in 5-d-old seedlings grown under standard conditions and then transferred onto control medium (top) or medium containing 5 μm zeocin (bottom) for a further 7 d of culture. Error bars indicate the mean ± sd of three independent experiments (4 < N [per genotype] < 37). Asterisks indicate significant difference between fbl17-1 and fbl17-1 sog1-1: *P < 0.05, **P < 0.01, and ***P < 0.001 by Wilcoxon-Mann-Whitney test. Complete statistical analyses are given in Supplemental Tables S4 and S5. B, Percentage of root length inhibition for the experiment described in A. Statistical significance was calculated by Wilcoxon-Mann-Whitney test. Box whiskers with different lowercase letters denote statistical differences determined by one-way ANOVA (P < 0.05 at least). Complete statistical analysis is given in Supplemental Table S6. C, Representative images of root tips of 5-d-old seedlings transferred onto control medium or medium containing 5 μm zeocin for a further 3 d of growth before propidium iodide staining. Scale bar = 50 μm. Three independent replicates were performed (4 < N [per genotype] < 11). D, Cell death quantification of the root samples illustrated in C on control medium (−) or medium containing 5 μm zeocin (+) for a further 3 d. Statistical significance analysis was calculated by Wilcoxon-Mann-Whitney test. Box whiskers with different lowercase letters denote statistical differences determined by one-way ANOVA (P < 0.05 at least). Complete statistical analysis is given in Supplemental Table S7.

