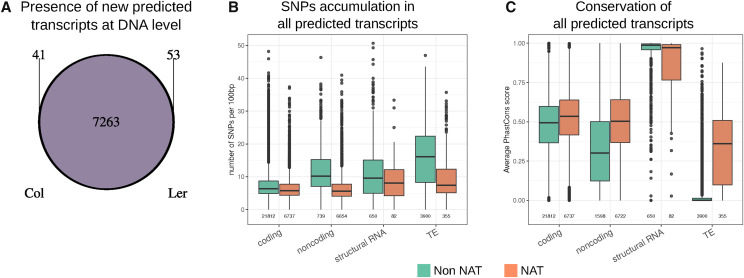
Figure 2.
Characterization of transcripts at the DNA level. A, Detection of the DNA sequences of previously uncharacterized predicted transcripts in the two ecotypes (minimum of 90% sequence identity along 90% of the RNA length). The large majority of RNAs come from common DNA regions from both ecotypes. B, SNP accumulation per 100 bp of transcript length for each type of transcript according to data from The 1001 Genomes Project (The 1001 Genomes Consortium, 2016). C, Conservation among plant species (average PhasCons score) of each type of transcript according to genomic position in relation to other annotations. In B and C, Non-NAT refers to transcripts which do not overlap with annotations on the other DNA strands, independent of annotation type (coding, noncoding, and structural RNA or TE).

