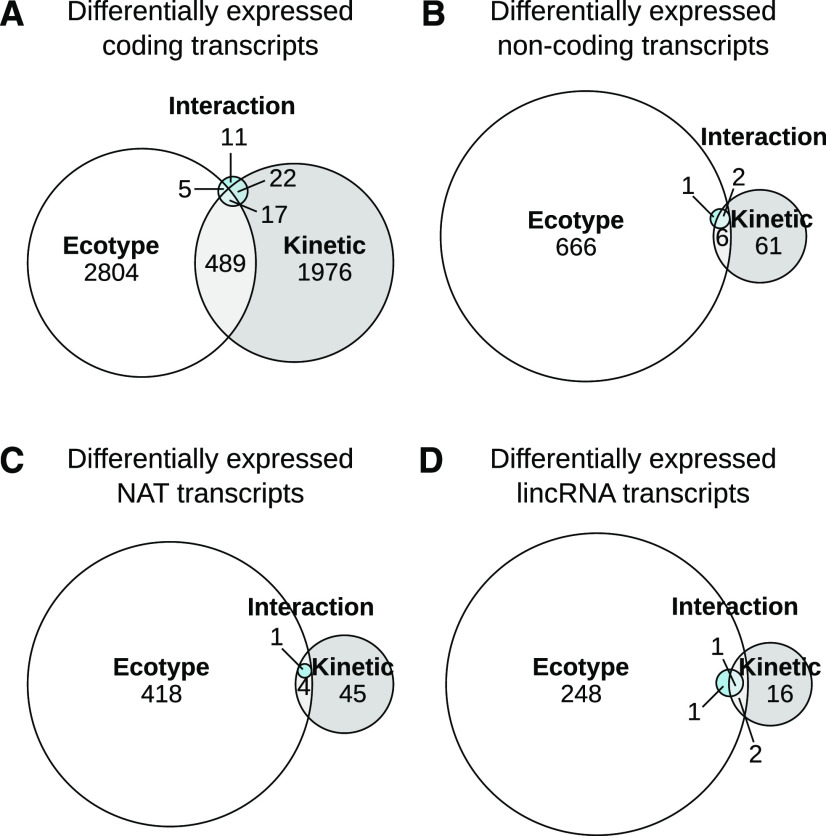
Figure 4.
Differentially expressed genes according to ecotype and kinetic effects. Statistical analysis revealed differentially expressed genes between ecotypes and kinetics during phosphate starvation treatments for coding and noncoding genes. The differentially expressed genes can be grouped according to their significant link with genotype effect (different level between the two ecotypes), kinetic effect (differential between any pair of time points in the phosphate starvation kinetics), and the interaction of the two effects (showing differential expression in response to phosphate stress according to genotype). After determining the global distribution, genes were partitioned between coding (A) and noncoding (B) transcripts. Among noncoding genes, we sorted transcripts according to their being antisense to another annotation (C) or intergenic (D).

