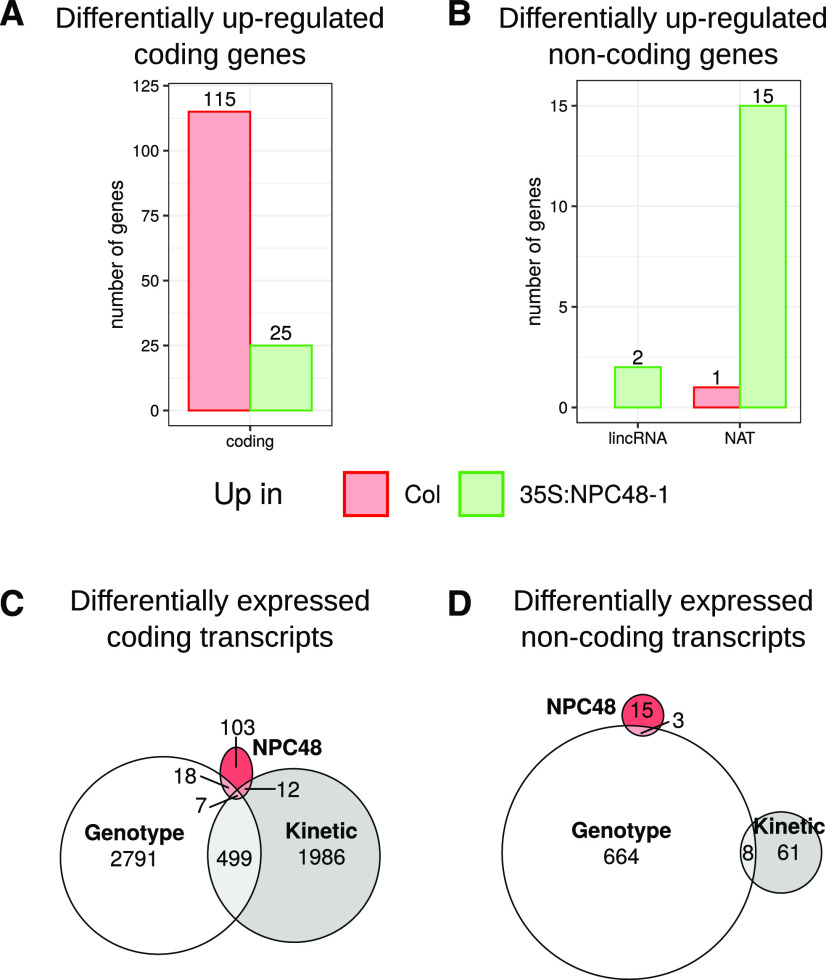
Figure 8.
Differentially expressed genes in plants overexpressing NPC48. A and B, Numbers of coding (A) and noncoding (B) genes showing statistically different expression levels in RNA-seq data between Col and 35S:NPC48-1. C and D, Venn diagrams showing how differentially expressed coding (C) and noncoding (D) genes in 35S:NPC48-1 correlate with those between Col and Ler or those found during the phosphate starvation kinetics.

