Figure 2.
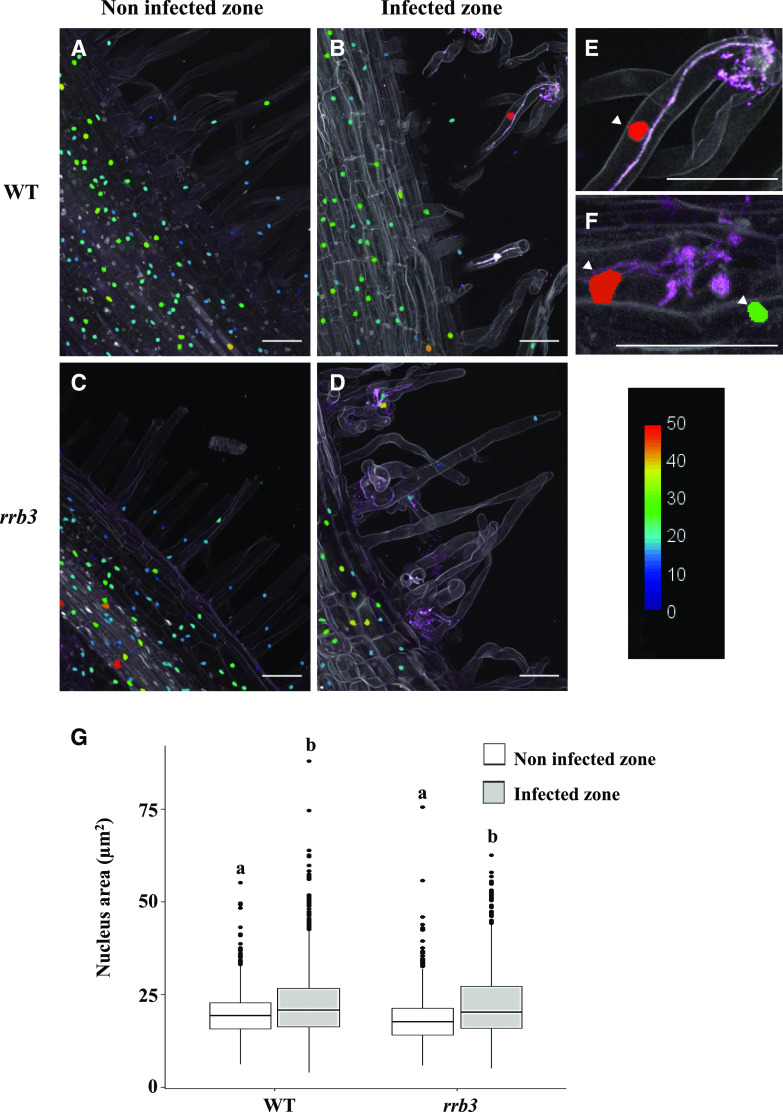
Increased nuclear area correlates with rhizobial infections. A to D, Representative longitudinal sections of wild-type (WT; A and B) and rrb3 (C and D) DAPI-stained roots 6 dpi with a WSM419-RFP rhizobium strain. Uninfected root regions (A and C) were compared to cells surrounding ITs (B and D). E and F, Magnifications of wild-type ITs in root hairs (E) or root cortex (F). Arrowheads indicate enlarged nuclei associated with infection events. The color scale represents the nuclear area (in micrometers squared). Each picture is representative of the nuclear area pattern observed in n > 15 sections from five independent roots per genotype and two independent experiments. Scale bars = 50 μm. G, Quantification of the nuclear area through a z-stack confocal projection (n > 15 sections from five independent roots per genotype from two independent experiments). A Kruskal-Wallis test was performed to assess significant differences (α < 0.05), indicated by lowercase letters.

