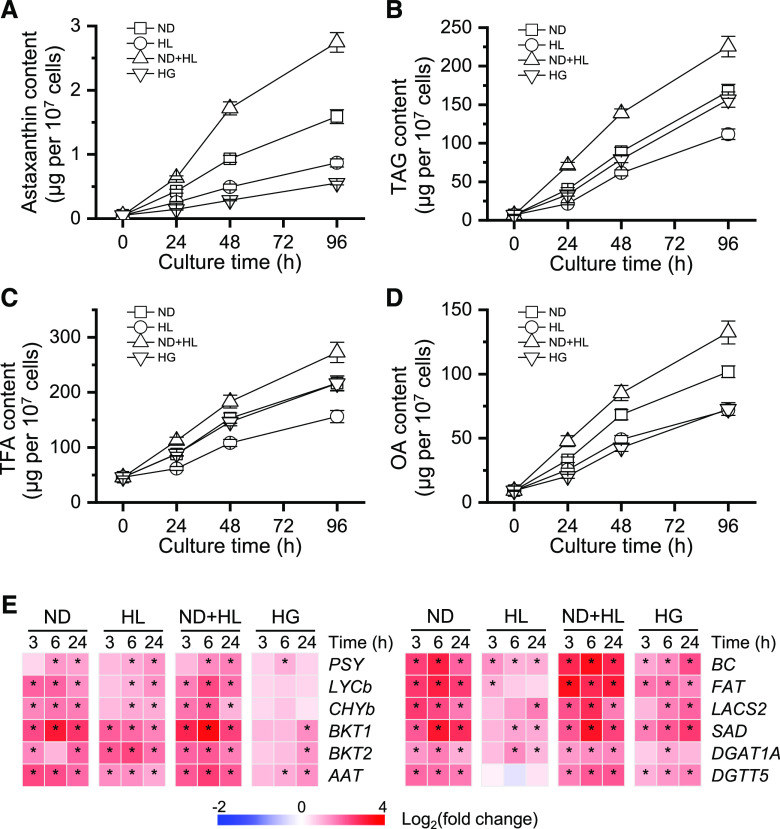
Figure 5.
Accumulation of astaxanthin and lipids under various inducing conditions of ND, HL, ND+HL, and HG. A to D, Time courses of astaxanthin content (A), TAG content (B), TFA content (C), and OA content (D). E, Heat map showing the transcript dynamics of selected genes involved in astaxanthin and TAG synthesis under different inducing conditions. The data are expressed as log2 (fold change) values of transcripts relative to the control (0 h), determined by RT-qPCR. Significant differences [absolute log2 (fold change) value > 1 and P < 0.01] are indicated with asterisks. Time refers to the duration in the induction conditions. Data represent means ± sd (n = 3).

