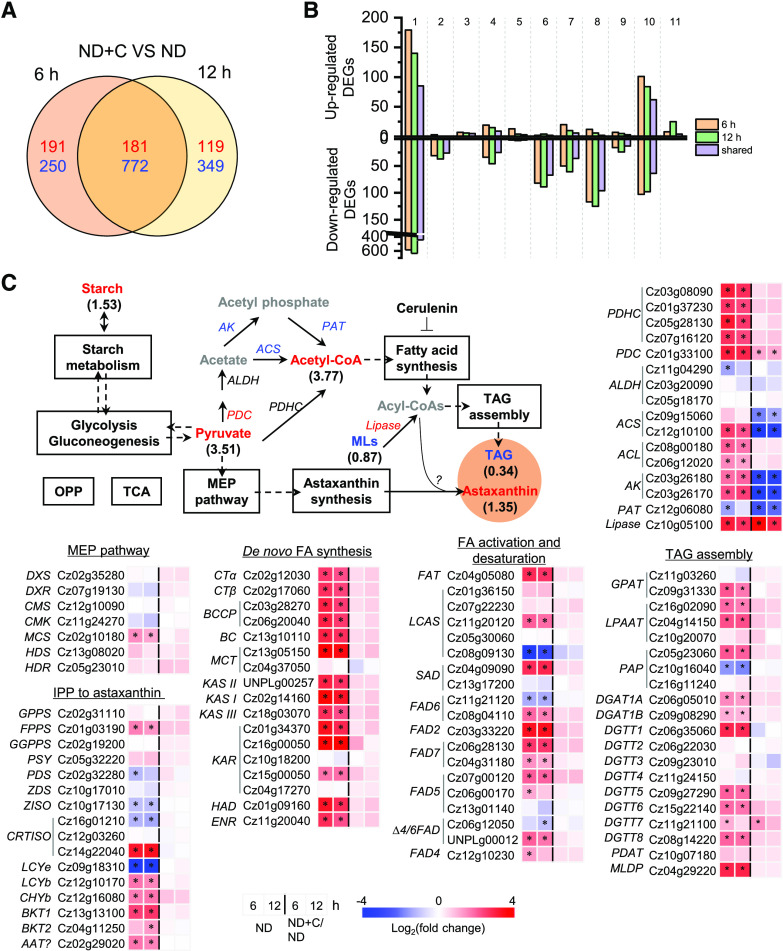
Figure 7.
Comparative transcriptomic analysis of ND-induced C. zofingiensis cells with and without cerulenin. A, Venn diagram of shared DEGs between 6 and 12 h of ND. The values in red indicate the number of up-regulated DEGs, whereas the values in blue designate the number of down-regulated DEGs in the presence of cerulenin compared with no cerulenin. B, Functional distribution of DEGs in up- and down-regulated categories, as follows: 1, function unknown; 2, cell cycle; 3, stress and cell death; 4, transport; 5, energy; 6, cell structure and component; 7, protein synthesis, modification, folding; and turnover; 8, DNA, RNA, and gene expression; 9, signaling; 10, metabolism; 11, photosynthesis. C, Transcriptional regulation of certain carbon metabolism pathways. Genes (italic) that are differentially expressed are shown in red (up-regulated) and blue (down-regulated). Compounds (roman) are shown in different colors: red, increased; blue, decreased; black, not determined or nonchanged. The pathways boxed in black indicate nonregulation. Values in parentheses designate fold changes of compound variation (48 h). The heat map shows log2 (fold change) values of transcripts. ACS, Acetyl-CoA synthetase; AK, acetate kinase; FA, fatty acid; MLs, membrane lipids; OPP, oxidative pentose phosphate pathway; PAT, phosphate acetyltransferase; PDC, pyruvate decarboxylase; TCA, tricarboxylic acid cycle. See Supplemental Data Set S2 for more details of the RNA-seq data.

