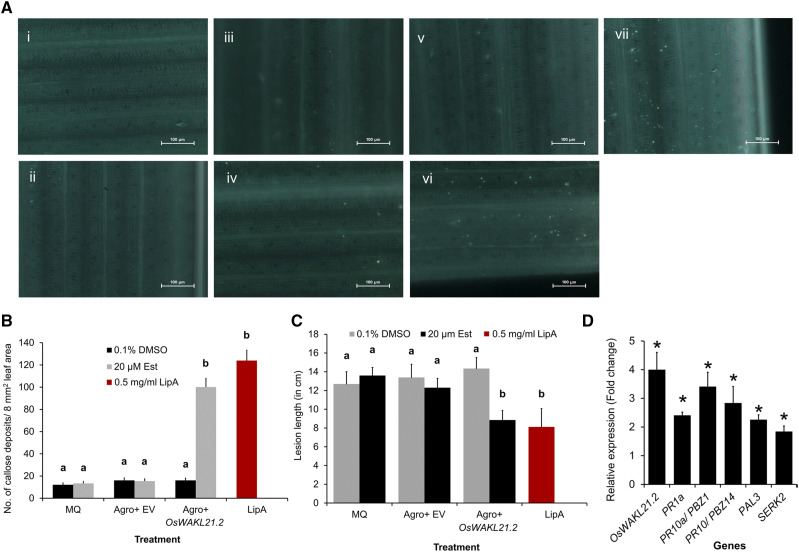
Figure 2.
Overexpression of OsWAKL21.2 in rice leaves induces plant immune responses. A, Callose deposition in rice leaves after treatment with various A. tumefaciens constructs or controls. The images shown are representative of one viewing area for each category. Numbered images are as follows: (i) 0.1% (v/v) dimethyl sulfoxide (DMSO); (ii) 20 µm Est; (iii) A. tumefaciens containing pMDC7 (empty vector [EV]) with 0.1% (v/v) DMSO; (iv) A. tumefaciens containing pMDC7 (empty vector) with 20 µm Est; (v) A. tumefaciens containing pMDC7::OsWAKL21.2 with 0.1% (v/v) DMSO; (vi) A. tumefaciens containing pMDC7::OsWAKL21.2 with 20 µm Est; and (vii) 0.5 mg mL−1 LipA. Images were taken at 20× magnification. Bars = 100 µm. B, Quantification of callose deposition in rice leaves after treatment with various A. tumefaciens constructs or controls as shown in A. Bar diagram shows the quantification of the number of callose deposits per area in rice leaves. Numbers of callose deposits in eight viewing areas (at 10× magnification) per leaf were considered. Each bar represents the average, and error bars represent se of 10 to 15 leaves per treatment in one set of experiments. Similar results were obtained in three independent experiments. C, Lesion length caused by Xoo in rice leaves when midveins of the leaves were previously treated with various A. tumefaciens constructs or controls. Midveins of rice leaves of 60-d-old plants were injected with MilliQ or water (MQ), LipA, or A. tumefaciens carrying empty vector or OsWAKL21.2 and also with (20 µm Est) or without (0.1% [v/v] DMSO) inducer. After 24 h, the leaves were pin-prick inoculated with Xoo 1 cm above the point of A. tumefaciens injection. Lesion length was measured after 10 d of infection with Xoo (Supplemental Fig. S2A). Each bar indicates the average, and error bars represent se of more than 20 leaves per treatment in one set of experiments. Similar results were obtained in three independent experiments. D, Relative expression of key defense-related genes after transient overexpression of OsWAKL21.2 in rice leaves. Each bar represents the average FC, and the error bars indicate se of three independent experiments (n = 12 in each experiment). For each gene, the transcript level of the uninduced condition (treatment with A. tumefaciens carrying OsWAKL21.2 with 0.1% [v/v] DMSO) was considered as 1 and was compared with the induced condition (treatment with A. tumefaciens carrying OsWAKL21.2 with 20 µm Est). OsACTIN1 was used as an internal control for RT-qPCR. The relative FC was calculated by using the 2−∆∆Ct method. Asterisks represent significant difference in FC using Student’s t test with P < 0.05. In A and B, 12- to 14-d-old rice leaves were infiltrated with MQ, A. tumefaciens carrying empty vector, or vector containing OsWAKL21.2 and also with (20 µm Est) or without (0.1% [v/v] DMSO) inducer. In B and C, lowercase letters (a and b) above the bars indicate significant differences with P < 0.05 using one-way ANOVA followed by the Tukey-Kramer multiple comparison test. MQ treatment indicates control without any A. tumefaciens treatment. In A, B, and C, leaves treated with LipA were used as positive controls.

