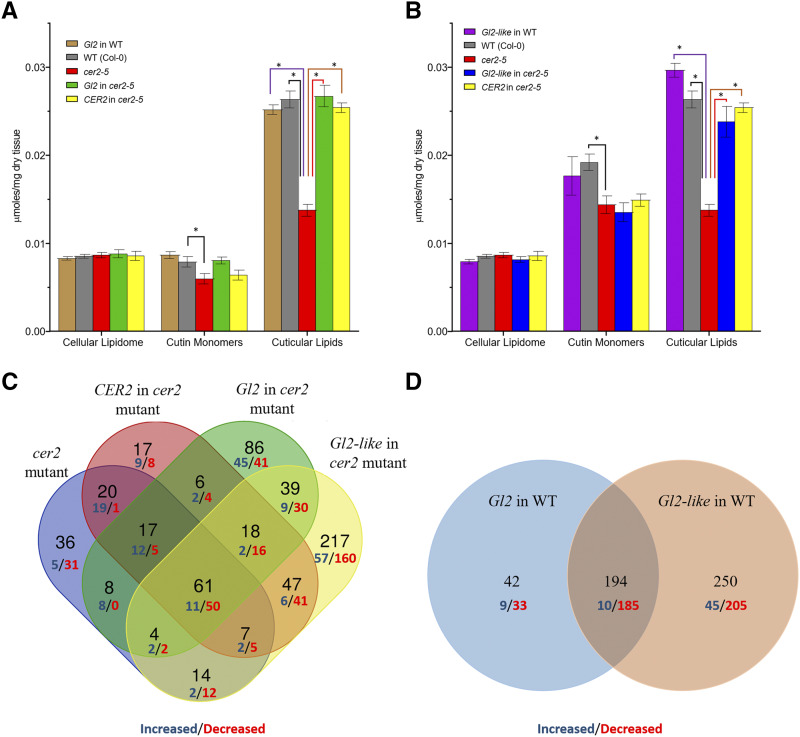
Figure 6.
Effect of Gl2 and Gl2-like transgenes on accumulation of Arabidopsis stem lipids. Comparison of the cellular lipidome, cutin monomer, and cuticular lipid content of nontransgenic wild-type (WT) and cer2-5 mutant stems and transgenic plants expressing Gl2 or CER2 (A) and Gl2-like or CER2 (B). The data represent means ± se of 4 to 15 replicates. Asterisks indicate genetic manipulations that result in statistically significant changes as evaluated by Student’s t test (P-value < 0.05). Venn-diagram representation of changes in the accumulation of analytes identified in the cellular lipidome of stems in response to the transgenic expression of Gl2, Gl2-like, and CER2 in the cer2-5 mutant background (C) or in a wild-type background (D). Each subset identifies the number of lipid analytes whose abundance is either increased (blue digits) or decreased (red digits) in the indicated genetic background. The digital data can be found in Supplemental Table S4. The altered accumulation levels are statistically significant based on evaluation by Student’s t test (P-value < 0.05).

