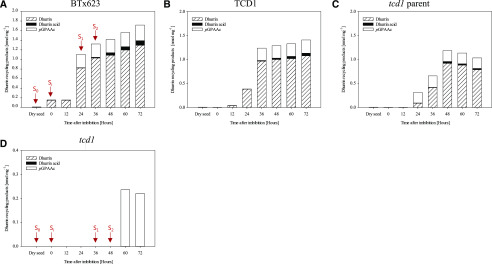
Figure 3.
Levels of dhurrin and its recycling products during germination and early seedling development in four sorghum lines. Absolute quantification of dhurrin, dhurrin acid, and pGPAAc in wild types is shown. cv BTx623 (A), TCD1 (B), tcd1 parent line (C), and mutant line tcd1 (D); note the different scale compared with A to C. For tcd1, pGPAAc was the only detected dhurrin related compound, and this was only detected at the last two time points (60–72 h AI). GS-pOHPACN was detected in the wild types, however, in minute concentrations, which are therefore shown separately in Supplemental Figure S1. Data for semiquantification of dhurrin glucosides are shown in Supplemental Figure S2. Arrows in A and D indicate the time points where the two lines analyzed by MSI had reached the different developmental stages S0 to S2. Values are mean of n = 3 biological replicate for each time point. Exact values and the calculated ses are listed in Supplemental Table S1.

