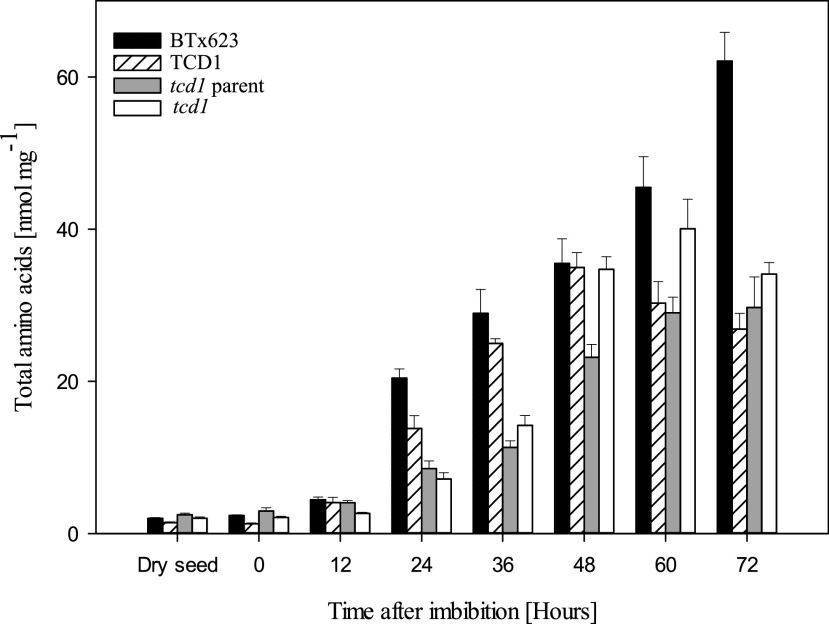
Figure 4.
Total free amino acids content during germination and early seedling development in four sorghum lines. The bars show the total sum of all free proteinaceous amino acids, except Gly, which could not be quantified with the applied method but is usually present in low amounts. Data for individual amino acids are shown in Supplemental Figure S3. Values are mean of n = 3 replicates for each time point. The error bars represent the se within the biological replicates.

