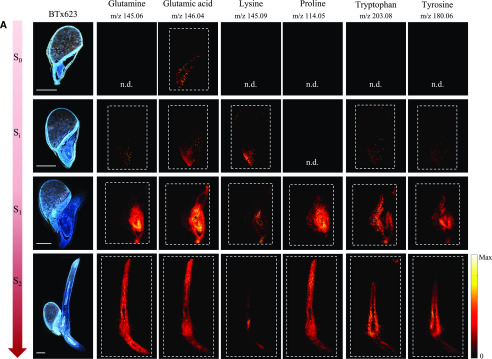
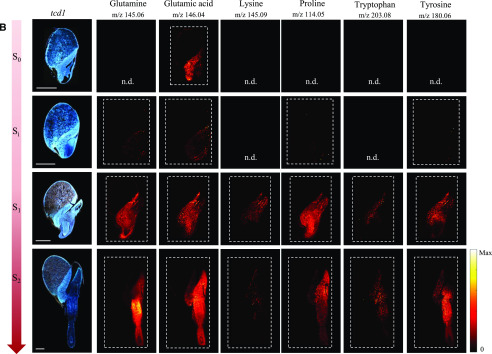
Figure 7.
Distribution of a selected subset of amino acids during germination and early seedling development in the cv BTx623 wild-type line and the mutant line tcd1. Procedures, settings, and overall layout as in Figure 5. A, cv BTx623. B, tcd1. Amino acids were all detected as deprotonated species, [M-H]−, in negative ionization mode. Scale bars = 1 mm. A full data set of distributions of all amino acids in one replicate of BTx623 and in all analyzed replicates for the selected subset of amino acids in cv BTx623 and the mutant line tcd1 are provided in Supplemental Figures. S8 and S9). All MS images were normalized to the TIC in each pixel, and maximum values for generating images are listed in Supplemental Figure S4.


