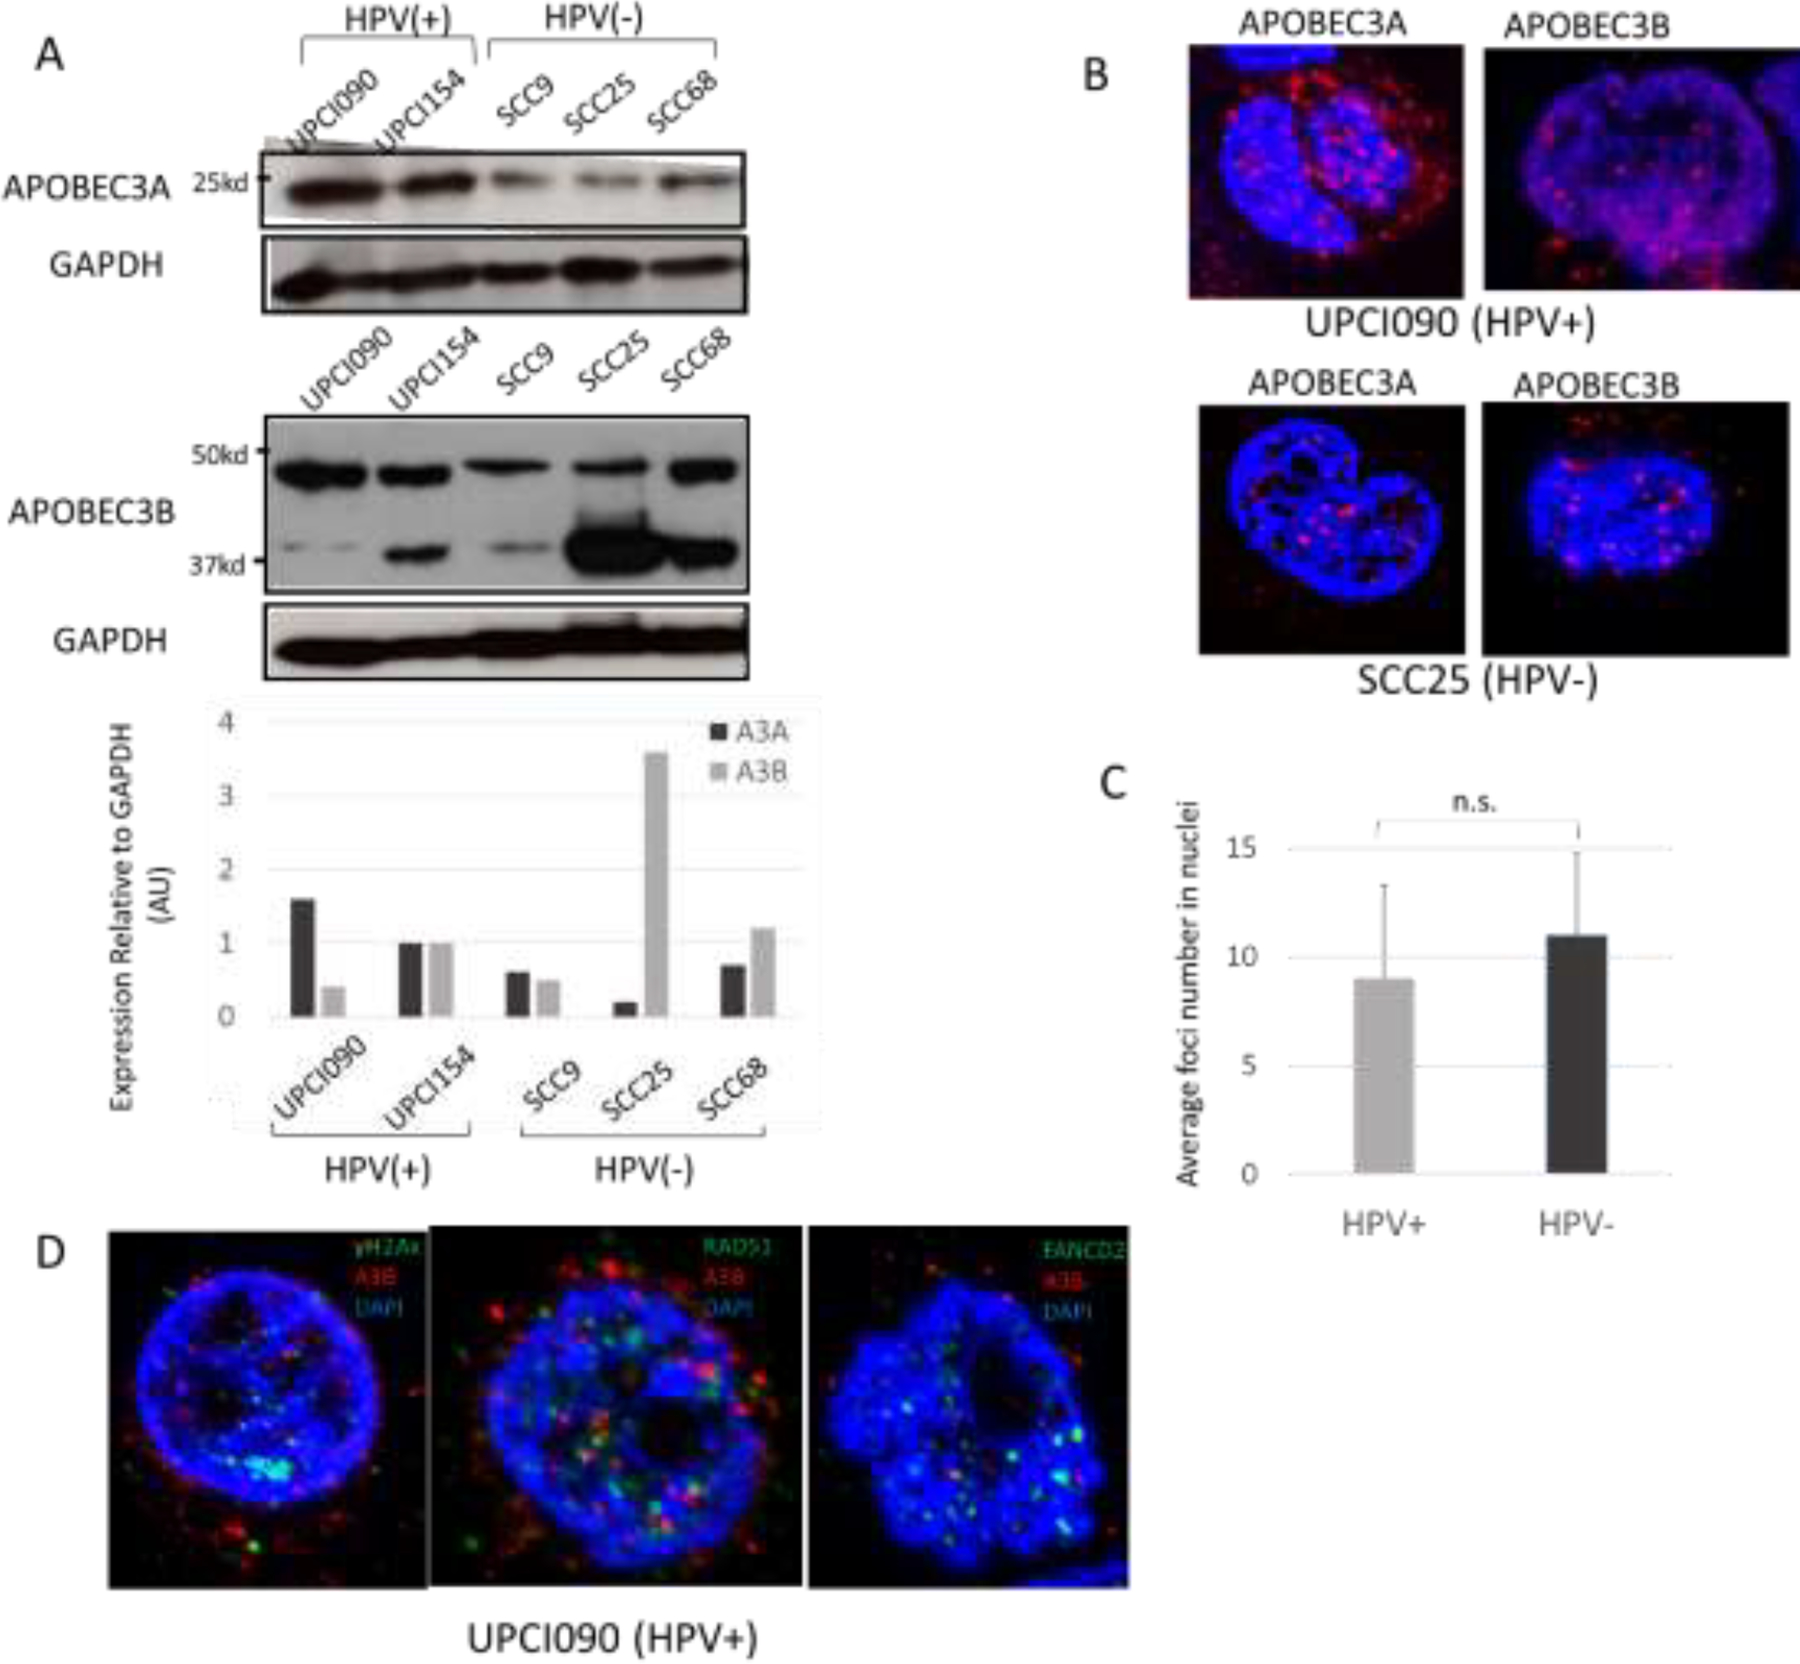
Fig. 5. Analysis of APOBEC3A and 3B levels and localization in HPV positive and negative OPC cell lines.

(A) Western blot analysis of APOBEC3A and 3B in HPV positive and negative cell lines. GAPDH was evaluated as a loading control. Quantitation of band intensity was analyzed by ImageJ software. For Western analysis, APOBEC3A antibody from Sigma and APOBEC3B antibody mAb 5210-87-13 (a gift from Harris lab) were used.
(B) Representative Immunofluorescence of APOBEC3A and 3B in HPV positive cell line (UPCI090) and HPV negative line (SCC25). For IF analysis, APOBEC3A antibody from Sigma and APOBEC3B antibody mAb 5210-87-13 (a gift from Harris lab) were used.
(C) Quantitation of average nuclear foci number in both HPV positive and negative cell lines (10 cells were examined in each group). P=0.24.
(D) Multicolor immunofluorescence of APOBEC3B and γH2AX, RAD51, FANCD2 in HPV positive cell line (UPCI090). Merged picture is shown.
